
EV charging station data analytics turns raw charger events, meter readings, fault codes and charging-session records into decisions that can reduce downtime, control electricity costs and identify poorly performing stations before they become expensive problems.
For a charging network operator, simply knowing that a charger is “online” is no longer enough.
A station can communicate with the backend and still deliver a poor charging experience. A connector may repeatedly fail authorization. A DC fast charger rated at 150 kW may spend much of its operating life delivering far less power. Payment terminals can fail while the charger itself remains healthy. Two chargers at the same site may also experience completely different utilization and fault patterns.
That is why useful EV charging analytics needs to work at several levels when scaling an EV charging network: network, site, charging station, EVSE, connector and individual charging session.
The objective is straightforward: find where money, energy and charging sessions are being lost, then determine why.
What Is EV Charging Station Data Analytics?
EV charging station data analytics is the collection and analysis of operational, electrical, transactional and customer-use data generated by EV charging infrastructure.
Depending on the hardware and charging-management platform, that information can include charger status, connector availability, charging-session start and stop times, energy delivered in kWh, charging power, voltage and current measurements, meter values, fault events, authorization attempts, payment results, communication failures, firmware data and temperature readings.
The real value comes from connecting these datasets.
A single fault message may tell an operator that something went wrong. Hundreds or thousands of charging sessions can reveal that the same fault usually appears after a particular temperature, power or communication pattern.
That turns monitoring into diagnosis. With enough reliable historical data, it can eventually become prediction.
Where Does EV Charger Data Come From?
A modern charging network rarely has one clean source of information.
Data may originate from the charging station, charging station management system (CSMS), payment processor, mobile application, roaming platform, energy-management system, utility meter and, in some cases, the vehicle itself.
One of the most important interfaces between the charger and backend is the Open Charge Point Protocol (OCPP), especially when comparing networked vs non-networked EV chargers.
OCPP 2.0.1 introduced stronger device-management, transaction, security, monitoring and smart-charging capabilities than OCPP 1.6. Its functional model includes metering, diagnostics, availability, transaction management and smart charging.
For 2026 deployments, OCPP 2.1 also deserves attention. It builds on OCPP 2.0.1 with support for areas including ISO 15118-20, bidirectional power transfer, distributed energy resource control and expanded smart-charging functionality.
That matters for analytics because richer communication between charging equipment and management platforms creates a more detailed view of network performance.
Protocol support alone, however, does not guarantee useful analytics. The data still has to be collected consistently, timestamped correctly, normalized and stored in a format that allows meaningful comparison across charger models and sites.
The EV Charging KPIs That Actually Matter
An analytics dashboard can contain dozens of charts and still fail to answer the questions an operator actually cares about.
A better approach is to start with operational questions and select metrics that answer them.
1. Charging Session Success Rate
One of the most useful questions is simple: when a driver tries to charge, does the session actually work?
A basic calculation is:
Successful charging sessions ÷ valid charging attempts × 100
The difficult part is defining a valid attempt.
A driver plugging in and immediately changing connectors should not necessarily be treated the same as a session that fails after authorization. Operators therefore need consistent rules for identifying attempted, abandoned, failed and successful sessions.
Where possible, failures should be classified by cause, including authorization failure, payment failure, vehicle-to-charger communication failure, connector fault, hardware fault, backend communication failure, emergency stop and grid or supply interruption.
A 96% session success rate tells you there is a problem. Failure classification tells you where to look.
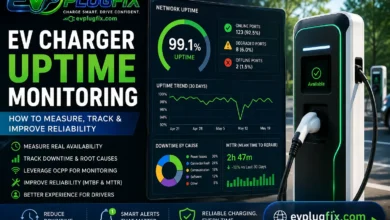
2. Charger Availability and Uptime
Uptime remains an important network metric, but it needs context.
A charger can report that it is available while a driver is unable to complete a successful charging session. Scheduled maintenance should also be separated from unexpected equipment failure where possible.
Operators should distinguish between communication uptime, technical availability, connector availability and driver-facing availability.
Driver-facing availability is particularly important because it asks whether a customer can arrive, authenticate, pay when required and successfully receive energy.
3. Utilization Rate
Utilization shows how heavily charging infrastructure is being used.
A simple time-based calculation is:
Occupied charging time ÷ available operating time × 100
But occupancy and active charging are not always the same thing.
An EV can remain connected after charging has finished. A vehicle can also occupy a charging bay while receiving little or no power.
For that reason, operators should consider tracking connector occupancy, active charging time, idle connected time, energy throughput and sessions per connector per day.
High occupancy with modest energy delivery may indicate long dwell times. High utilization combined with frequent queues can indicate that a site is approaching its practical capacity. Very low utilization may point to weak demand, poor visibility, pricing problems or unreliable equipment.
4. Energy Delivered
Energy throughput is one of the clearest measurements of actual charging activity.
Operators should track kWh delivered by session, connector, charger, site, day, week and month.
Energy data becomes more valuable when it is compared with revenue, electricity cost, installed power and utilization.
Two sites may complete the same number of sessions while one delivers twice as much energy. Their economics can therefore be very different.
5. Average and Peak Charging Power
Do not judge DC charging performance only from the number printed on the charging cabinet.
A 150 kW charger does not guarantee a 150 kW charging session.
Actual power can be limited by the EV’s charging curve, battery state of charge, battery temperature, charger power sharing, thermal conditions, cable limits or site-level load-management controls.
Analytics should therefore examine the charging power curve rather than relying only on maximum observed power.
Useful measurements include average session power, peak session power, time spent above selected power thresholds, requested versus delivered power and repeated derating events.
If one connector consistently delivers less power than an equivalent connector operating under similar conditions, it deserves investigation.
6. Mean Time Between Failures and Mean Time to Repair
Two traditional reliability metrics are particularly useful for large charging fleets:
MTBF — Mean Time Between Failures
MTTR — Mean Time to Repair
MTBF helps identify equipment that fails unusually often, while MTTR measures how quickly those failures are resolved.
The distinction matters. A network may have reliable hardware but slow field-service response, resulting in long outages. Another may repair faults quickly but experience so many repeated failures that maintenance costs remain high.
Operators should track both. Understanding these factors is critical for managing overall EV charger maintenance costs over the lifetime of a charging site.
7. Fault Frequency by Component
A generic “charger fault” category wastes useful information.
Where the equipment exposes sufficient diagnostics, operators should classify problems by subsystem or component, including the connector, charging cable, contactor, power module, cooling system, insulation monitoring system, card reader, payment terminal, modem, display, RFID reader, temperature sensor and internal communication hardware.
Failure frequency can then be compared by charger model, firmware version, site and equipment age.
Patterns become much easier to identify.
8. Revenue per Charger and Revenue per kWh
Operational analytics should eventually connect directly to financial performance.
A commercial network should be able to compare revenue per session, revenue per connector, revenue per charger, revenue per kWh, energy cost per kWh sold and gross charging margin.
These measurements can expose stations that look busy but produce weak margins.
9. Average Session Duration
Average session duration shows how long a connector remains tied to each charging event and can reveal very different operating patterns across sites.
The number needs context. A long session at an AC workplace charger may be completely normal, while unusually long sessions at a busy DC fast-charging hub can reduce the number of drivers a connector can serve each day.
Operators should compare session duration by charger type, power level, location and time of day. It is also useful to separate active charging time from the total time a vehicle remains connected.
If session duration increases while energy delivered remains roughly unchanged, drivers may be occupying chargers longer without purchasing more energy. That can become a capacity problem long before the site’s electricity supply reaches its limit.
10. Idle Time per Connector
Idle connected time measures how long an EV remains plugged in after meaningful charging has ended.
This is particularly useful at high-utilization locations because a connector can appear occupied even though it is no longer delivering significant energy.
Operators can track:
- idle minutes per session;
- percentage of occupied time spent idle;
- idle time by hour of day;
- connectors with unusually high idle occupancy.
Persistent idle time can indicate that a site needs clearer driver notifications, different parking rules or an idle-fee policy where appropriate. Before making those changes, operators should distinguish genuine post-charge occupancy from sessions where charging stopped unexpectedly because of a fault.
11. Peak Site Demand and Load Factor
Individual charger utilization does not show the full electrical impact of a charging site. Operators also need to know how the combined load behaves at the grid connection.
Peak site demand records the highest combined power draw during the relevant measurement interval, while load-factor analysis helps show whether that peak is sustained or occurs only during short periods.
For example, a site may rarely exceed 300 kW but occasionally jump above 500 kW when several fast-charging sessions overlap. Those short peaks can matter when evaluating demand charges, transformer capacity and future expansion.
Tracking peak demand alongside connector utilization allows operators to determine whether additional grid capacity is genuinely required or whether smart charging and dynamic load management could make better use of the existing connection.
12. Repeat Driver Rate
Technical reliability does not tell operators whether drivers actually want to return.
Where customer identification can be measured lawfully and with appropriate privacy controls, repeat driver rate can show the percentage of identifiable customers who return to the same site or charging network over a defined period.
This metric becomes more useful when analyzed alongside session success, charging speed, pricing and availability.
A site may have strong utilization because of its location while still losing repeat customers after failed sessions or poor charging performance. Conversely, rising repeat usage can indicate that drivers trust the site’s reliability even when overall traffic is still developing.
Operators should avoid treating repeat-driver data as a standalone loyalty score. Anonymous charging, roaming customers and one-time highway traffic can all affect the result, so comparisons should be made between similar types of charging locations.
Electricity tariffs, demand charges, roaming fees, payment fees and maintenance expenses can materially change the economics of two otherwise similar charging sites.
Building a Useful EV Charging Analytics Architecture
A practical charging analytics system can be viewed as a pipeline:
Charging Station → CSMS → Data Storage → Processing → Analytics → Alerts and Actions
The charger generates operational events and measurements. The CSMS receives and manages much of that information. A data platform stores historical records so events from different stations and time periods can be compared.
Processing layers then clean and normalize the records. Dashboards, rules and analytical models convert that processed information into decisions operators can act on.
The weakest link is often data quality.
Why Clean Charger Data Matters
Bad input can produce convincing-looking but misleading dashboards.
Common EV charging data problems include missing meter values, duplicate events, incorrect timestamps, charger clock drift, inconsistent fault-code definitions, missing transaction-end records, connectivity interruptions and inconsistent identifiers across payment, roaming and CSMS platforms.
Time synchronization deserves particular attention.
If charger events, payment records and backend logs use different clocks, reconstructing a failed charging session can become surprisingly difficult.
Before applying sophisticated analytics, operators should establish a reliable data model and consistent event definitions.
Predictive Maintenance: Finding Failures Before the Charger Stops Working
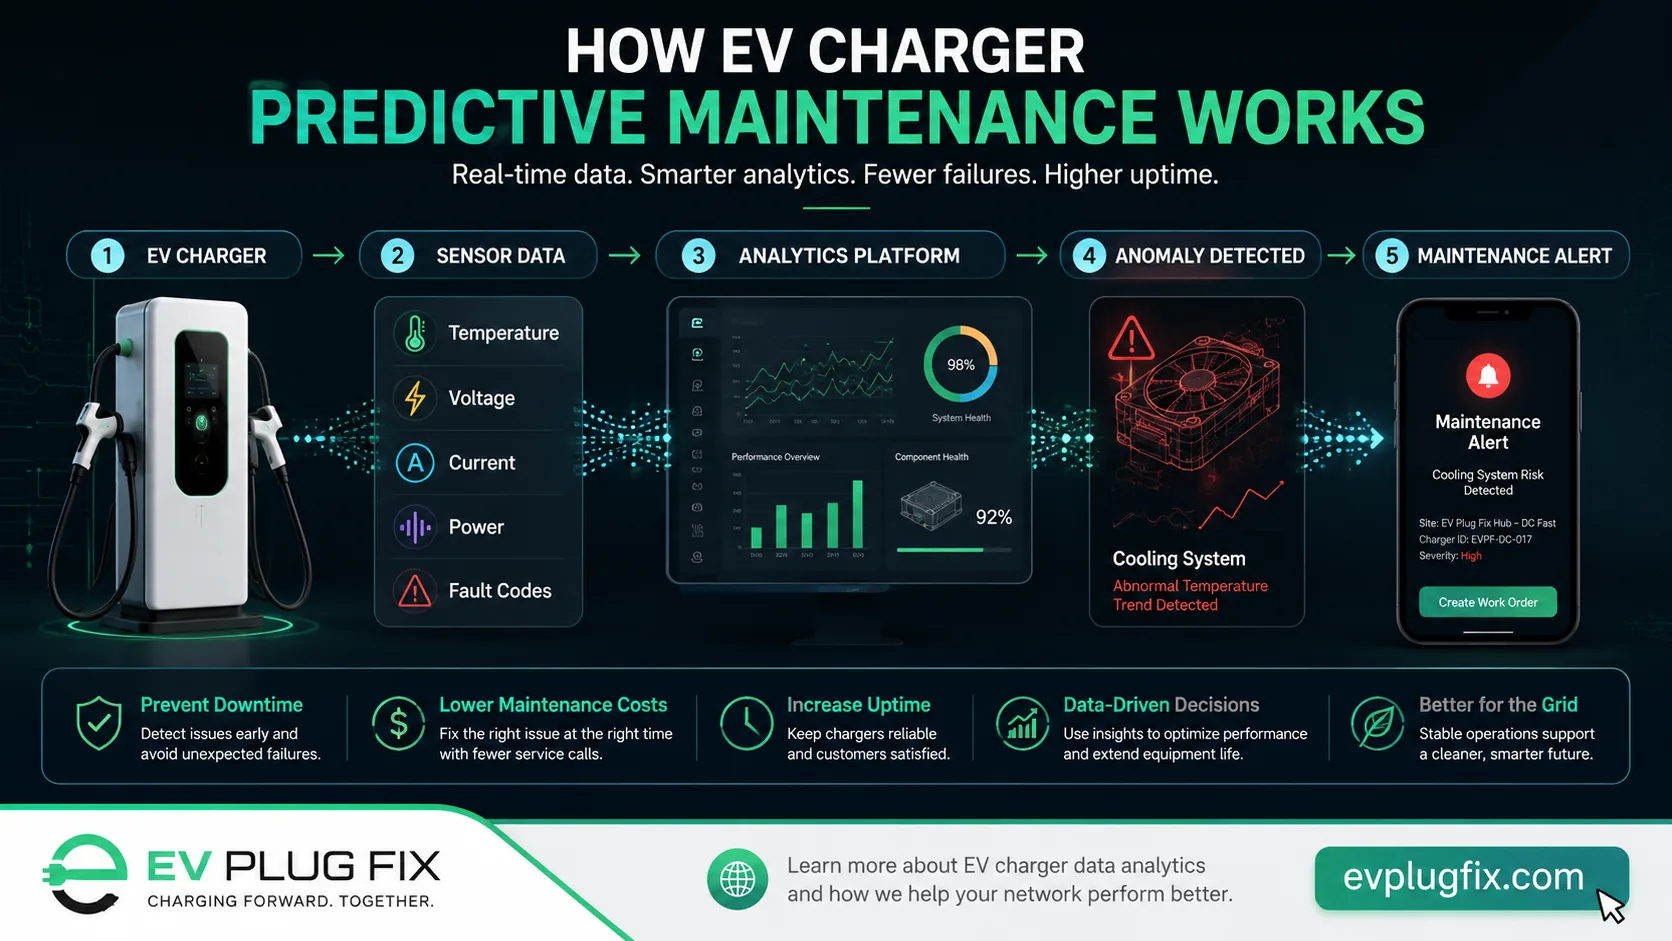
Predictive maintenance is one of the most useful applications of charging data, but it does not always require artificial intelligence.
Simple rules can identify many emerging problems.
If a charger normally operates within a known temperature range and begins running hotter under similar charging loads, the system can flag it for inspection before a shutdown occurs.
Similar monitoring can detect repeated contactor faults, rising connector temperatures, abnormal voltage behavior, frequent communication resets, falling power output, cooling-system warnings, insulation faults and repeated session initialization failures.
Anomaly Detection
The next level is anomaly detection.
Instead of applying one fixed threshold, software can establish a normal operating pattern and identify unusual behavior.
Imagine ten identical DC chargers. Nine maintain similar temperature and charging-power profiles. The tenth begins running hotter and periodically derating at loads that previously caused no problem.
That difference may be more informative than whether the charger has crossed a generic temperature limit.
From Predictive Maintenance to Failure Probability
Networks with enough historical failure records can build more sophisticated predictive models.
Input variables may include equipment age, charging cycles, operating hours, energy throughput, temperature history, fault frequency, restart frequency, power-module behavior, firmware version and environmental conditions.
The model could then estimate the probability that a specific component will fail within a defined period.
This allows maintenance teams to prioritize assets according to risk instead of servicing every charger on the same fixed schedule.
There is an important limitation: predictive models are only as useful as the historical failure data used to train them.
If maintenance records simply say “charger repaired,” there is very little information about what actually failed.
Good predictive analytics starts with good maintenance records.
Using Analytics to Reduce Demand Charges
For commercial charging sites, electricity cost is not determined only by total energy consumption.
Depending on the utility tariff, the site’s highest power demand during a billing interval can have a substantial effect on the electricity bill.
EV fast charging can produce sharp load peaks.
If several high-power chargers start simultaneously, total site demand may rise rapidly even if that maximum demand lasts only a short period.
Analytics can identify when peaks occur, how often they happen, which chargers contribute to them and whether they correspond with predictable traffic periods.
The operator can then evaluate smart charging and load-management strategies.
Dynamic Load Management
Rather than allowing every connected EV to request unrestricted power simultaneously, a site controller or backend can allocate available electrical capacity dynamically using strategies such as dynamic load balancing for EV chargers.
Consider a site with four 150 kW DC charging points but a practical site limit below 600 kW.
If only one vehicle is charging, it may receive the maximum power available within vehicle and infrastructure limits. When several vehicles connect, the site’s energy-management system can distribute power between them while keeping total demand below the configured ceiling.
Modern OCPP implementations support smart-charging functions that can influence the current or power available to individual charging sessions.
The analytics layer helps determine when those controls should be applied and what effect they have on electricity cost and charging performance.
Don’t Optimize Demand Charges at the Expense of Drivers
Aggressive power limiting can reduce electricity costs while damaging the customer experience.
If a network advertises high-power DC charging but repeatedly restricts customers to much lower charging speeds, electricity costs may fall while customer satisfaction declines.
Analytics should therefore balance several objectives at the same time:
Energy cost + demand cost + charging performance + customer waiting time + site capacity
The goal is not simply to consume the least electricity. It is to deliver the required energy efficiently while maintaining acceptable charging performance and avoiding unnecessary demand peaks.
EV Charging Pricing Analytics
Charging prices should not be selected blindly.
Historical session data can reveal how customers respond to different prices and times of day.
Operators can compare sessions before and after a price change, utilization by hour, revenue per occupied hour, revenue per kWh, charging demand by day of week, utilization at nearby stations and customer response to off-peak pricing.
This can support time-of-use or dynamic pricing where regulations, billing systems and market conditions allow it. Implementing appropriate public EV charging pricing strategies ensures site profitability while remaining competitive.
Pricing analytics should still account for customer expectations. A system that changes prices constantly without clear communication may improve one financial metric while reducing long-term customer retention.
Detecting Underperforming Charging Sites
One of the biggest advantages of network-wide analytics is comparison.
Looking at a single charger provides limited context. Comparing hundreds of stations makes outliers easier to identify.
Suppose one site consistently shows lower session success, longer sessions, lower delivered power, more resets, more payment failures and higher maintenance costs than similar locations.
That site should move near the top of the investigation queue.
The cause may be hardware, but it could also be weak cellular connectivity, a local electrical problem, software configuration, parking enforcement or the types of vehicles frequently using that location.
Analytics identifies the anomaly. Operations teams still need to establish the cause.
Cohort Analysis Can Reveal Hardware Problems
Instead of comparing the entire charging network as one group, operators can create cohorts based on charger manufacturer, model, power rating, installation year, firmware version, climate, site type, charging technology or connector type.
Then the question becomes more precise.
Do chargers running firmware version X have a higher failure rate than identical chargers running version Y?
That is much more actionable than simply knowing the network averages 98% availability.
The same method can help procurement teams evaluate hardware before future network expansion.
Analytics for Charging Site Expansion
Historical charging demand can help determine where additional capacity is actually required.
Signals that a site may be approaching its practical capacity include consistently high utilization, frequent simultaneous sessions, growing queue times, high occupancy during predictable periods and sustained energy throughput.
High utilization alone, however, does not automatically justify another charger.
A site overloaded for 30 minutes each morning presents a different investment case from one operating near capacity for ten hours every day.
Detecting Stranded Charging Assets
The opposite problem is equally important.
Some chargers consume maintenance, networking, lease and support resources while attracting very little demand.
A low-utilization station should be investigated before it is removed.
Operators should ask whether the equipment is reliable, whether the site appears correctly in navigation apps, whether pricing is competitive, whether access is restricted, whether drivers are arriving but failing to start sessions and whether charging power is appropriate for the location.
A site can appear to have a demand problem when it actually has a reliability problem.
That is why usage data should never be analyzed in isolation.
Driver Experience Can Be Measured
Customer surveys are useful, but charging-session data provides another view of driver experience.
Repeated start attempts may indicate authentication or communication problems. Connector switching can show that a driver tried one charging point and immediately moved to another. Very short sessions may indicate charging or payment problems when they occur repeatedly.
Unexpectedly low charging power also matters. A session may technically succeed while performing poorly enough to frustrate the driver.
These behaviors provide a more realistic picture of network reliability than a simple online/offline status.
Estimating EV Charger Queues
At busy charging hubs, analytics can also improve availability estimates.
Historical data can help estimate expected session duration, typical departure times, the probability that a connector becomes available within a given period and the busiest hours for a location.
A driver does not only want to know whether all chargers are currently occupied.
They want to know: how long am I likely to wait?
Useful estimates require enough historical observations and, ideally, real-time session information.
OCPP 2.0.1, OCPP 2.1 and EV Charging Analytics
OCPP has become increasingly important to sophisticated charger monitoring.
OCPP 2.0.1 introduced a device model that supports more advanced configuration and monitoring than earlier protocol versions, alongside improved transaction handling, security, smart charging and ISO 15118-related functionality.
For operators building new analytics platforms in 2026, OCPP 2.1 expands the possibilities further with support for ISO 15118-20, bidirectional power transfer, DER control and additional smart-charging functionality.
This creates a richer environment for future charging and energy-management systems.
It also creates more data.
The challenge increasingly becomes deciding which information deserves attention rather than simply obtaining more information.
Vehicle-to-Grid Analytics Changes the Equation
Traditional EV charging analytics follows electricity in one direction:
Grid → Charger → Vehicle
Bidirectional charging introduces another possible flow:
Vehicle → Charger → Building or Grid
An analytics platform may then need to consider battery state of charge, driver departure requirements, minimum required battery level, charging and discharging power, electricity prices, grid signals, battery constraints, site load and renewable generation.
OCPP 2.1 support for ISO 15118-20 and bidirectional charging makes this particularly relevant to future-ready network architectures.
The optimization question becomes significantly more complex.
Instead of asking, “When should this EV charge?” the system may eventually need to decide whether an EV should charge, wait, reduce power or discharge, and for how long.
EV Charging Data Security Cannot Be an Afterthought
More data also creates more responsibility.
Charging networks may process information associated with customer accounts, authentication credentials, payment systems, charging behavior and vehicle interactions.
Operational data can also expose network architecture, firmware information, equipment status and other information that should be protected.
Analytics platforms should therefore use appropriate access controls, encryption, credential management, retention policies, audit logging, network segmentation, software patching and data minimization.
Collecting every possible variable indefinitely is not automatically a good analytics strategy.
Data should be collected because it serves a defined operational or business purpose.
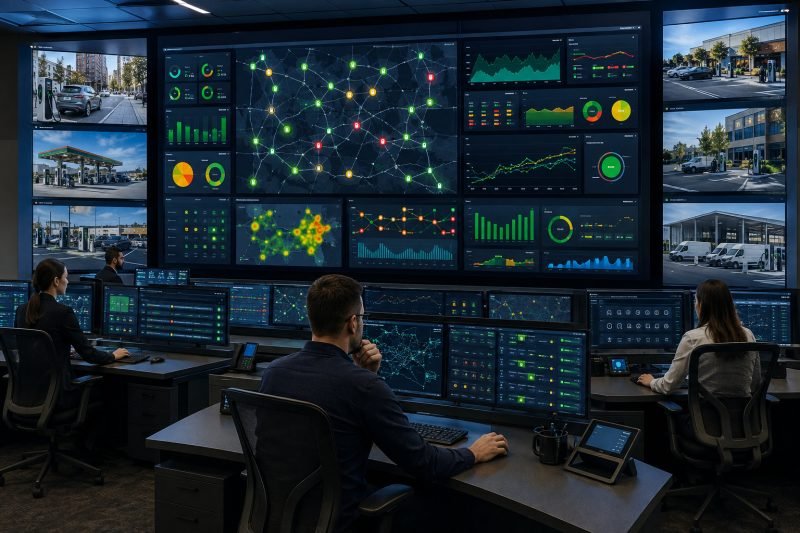
A Practical EV Charging Analytics Dashboard
A useful operational dashboard should focus on measurements that trigger decisions rather than filling the screen with unnecessary charts.
| KPI | What It Reveals |
|---|---|
| Session success rate | Whether drivers can actually complete a charging session |
| Operational availability | Whether charging infrastructure is usable |
| Utilization | How heavily charging assets are being used |
| Energy delivered | Actual charging throughput |
| Average and peak power | Charging performance |
| Failed sessions by cause | Where charging sessions are breaking down |
| MTTR | Maintenance response effectiveness |
| Repeat faults | Persistent equipment or software problems |
| Peak site demand | Exposure to grid-capacity and demand costs |
| Revenue per charger | Commercial performance |
Every top-level KPI should ideally allow operators to drill down to the site, charger, connector and individual charging session.
Set Alerts Around Action, Not Noise
A common monitoring mistake is creating an alert for every abnormal event.
Operations teams quickly become numb to excessive notifications.
Alerts should correspond to conditions that require a clear response.
- Critical: A charger is unavailable and no redundant connector exists.
- High: Repeated charging-session failures occur on the same EVSE.
- Medium: An abnormal temperature trend or repeated power derating is detected.
- Low: Utilization has fallen significantly compared with the site’s historical baseline.
How to Start an EV Charging Analytics Program
Do not begin with machine learning.
Begin with a business problem.
Choose a measurable target such as reducing failed sessions, lowering maintenance costs or controlling peak site demand.
Then identify the minimum data required to understand that problem.
For failed sessions, that may include transaction records, charger status, authorization events, fault codes and payment outcomes.
For peak-demand management, operators need synchronized power data from the charging equipment and the site’s electrical system.
For predictive maintenance, diagnostic variables must be combined with accurate historical maintenance and failure records.
Build reliable data first. Automate decisions second. Machine learning comes later if the dataset and business case justify it.
Common EV Charging Analytics Mistakes
- Treating Uptime as the Only Reliability Metric: Online does not necessarily mean usable. Track successful charging outcomes as well as connectivity.
- Comparing Unlike Chargers: A motorway DC fast-charging hub should not be benchmarked directly against an AC workplace charger without context. Use cohorts based on equipment type and site purpose.
- Ignoring Failed Attempts: Completed transactions show what worked. Failed and abandoned attempts often reveal what needs fixing.
- Collecting Data Without Maintenance Labels: Predictive maintenance requires knowing what actually failed and what technicians did to repair it.
- Looking Only at Network Averages: A strong network average can hide several poorly performing sites. Analytics should always allow drill-down to individual EVSEs and connectors.
- Assuming Every Low-Power Session Is a Charger Fault: The EV itself can limit charging power. Vehicle capability, battery state of charge and thermal conditions should be considered whenever those data are legitimately available.
- Deploying AI Before Fixing Data Quality: No algorithm can reliably compensate for inconsistent identifiers, missing events and badly synchronized timestamps.
Frequently Asked Questions
What data do EV charging stations collect?
Depending on the charger and management platform, EV charging stations can generate transaction records, meter readings, charging power measurements, current and voltage data, charger status, diagnostic information, fault events, authorization data and device-monitoring variables. Payment, roaming, mobile-app and energy-management systems can provide additional data.
What is the most important EV charging KPI?
There is no single KPI for every charging network, but session success rate is one of the strongest measures of driver-facing reliability because it measures whether a charging attempt actually results in energy being delivered. It should be evaluated alongside availability, utilization, energy delivered, fault frequency and repair time.
How can data analytics reduce EV charger downtime?
Analytics can identify recurring faults, abnormal equipment behavior and performance deterioration before complete failure occurs. Historical data can also reveal whether particular charger models, components or firmware versions experience unusually high failure rates.
Can EV charger analytics predict failures?
Yes. Prediction can range from simple threshold monitoring and trend analysis to statistical or machine-learning models that estimate component failure probability. The quality of the results depends heavily on accurate historical fault and maintenance data.
How can EV charging analytics reduce electricity costs?
Time-aligned charging data shows when site power demand peaks and which chargers contribute to those peaks. Smart charging, power sharing and dynamic load management can then control charging demand while maintaining acceptable driver service. Dynamic pricing and demand-response programs may provide additional options depending on the market and electricity tariff.
What is the role of OCPP in EV charging analytics?
OCPP provides standardized communication between charging stations and charging station management systems. Modern OCPP versions include functionality for metering, transactions, diagnostics, device monitoring and smart charging. OCPP 2.1 expands the available functionality with areas including ISO 15118-20, bidirectional charging and DER control.
What is the difference between charger uptime and session success rate?
Uptime measures whether charging equipment is available or operational during a defined period. Session success rate measures whether drivers who attempt to charge actually complete a successful charging session. A charger can have strong uptime figures while still producing repeated payment, authorization or connector failures.
Can charging station analytics help determine where to install new chargers?
Yes. Utilization, simultaneous charging sessions, queue patterns, energy throughput, session duration and demand growth can help operators identify locations where additional capacity is justified. These metrics should be evaluated together rather than relying on utilization alone.
Bottom Line
EV charging station data analytics in 2026 is not about collecting the largest possible volume of charger data. It is about turning the right data into measurable operational decisions.
The strongest analytics programs connect charger reliability, charging-session performance, energy consumption, electricity costs, maintenance records and customer behavior.
For operators, that can mean fewer failed sessions, faster repairs, better equipment purchasing decisions, lower energy costs and more profitable charging sites.
For drivers, the benefits are simpler: chargers that work more often, clearer availability information, shorter waits and more predictable charging performance.
The charging networks that understand the difference between a charger being online and a driver actually receiving a successful charge will have the clearest operational advantage.