
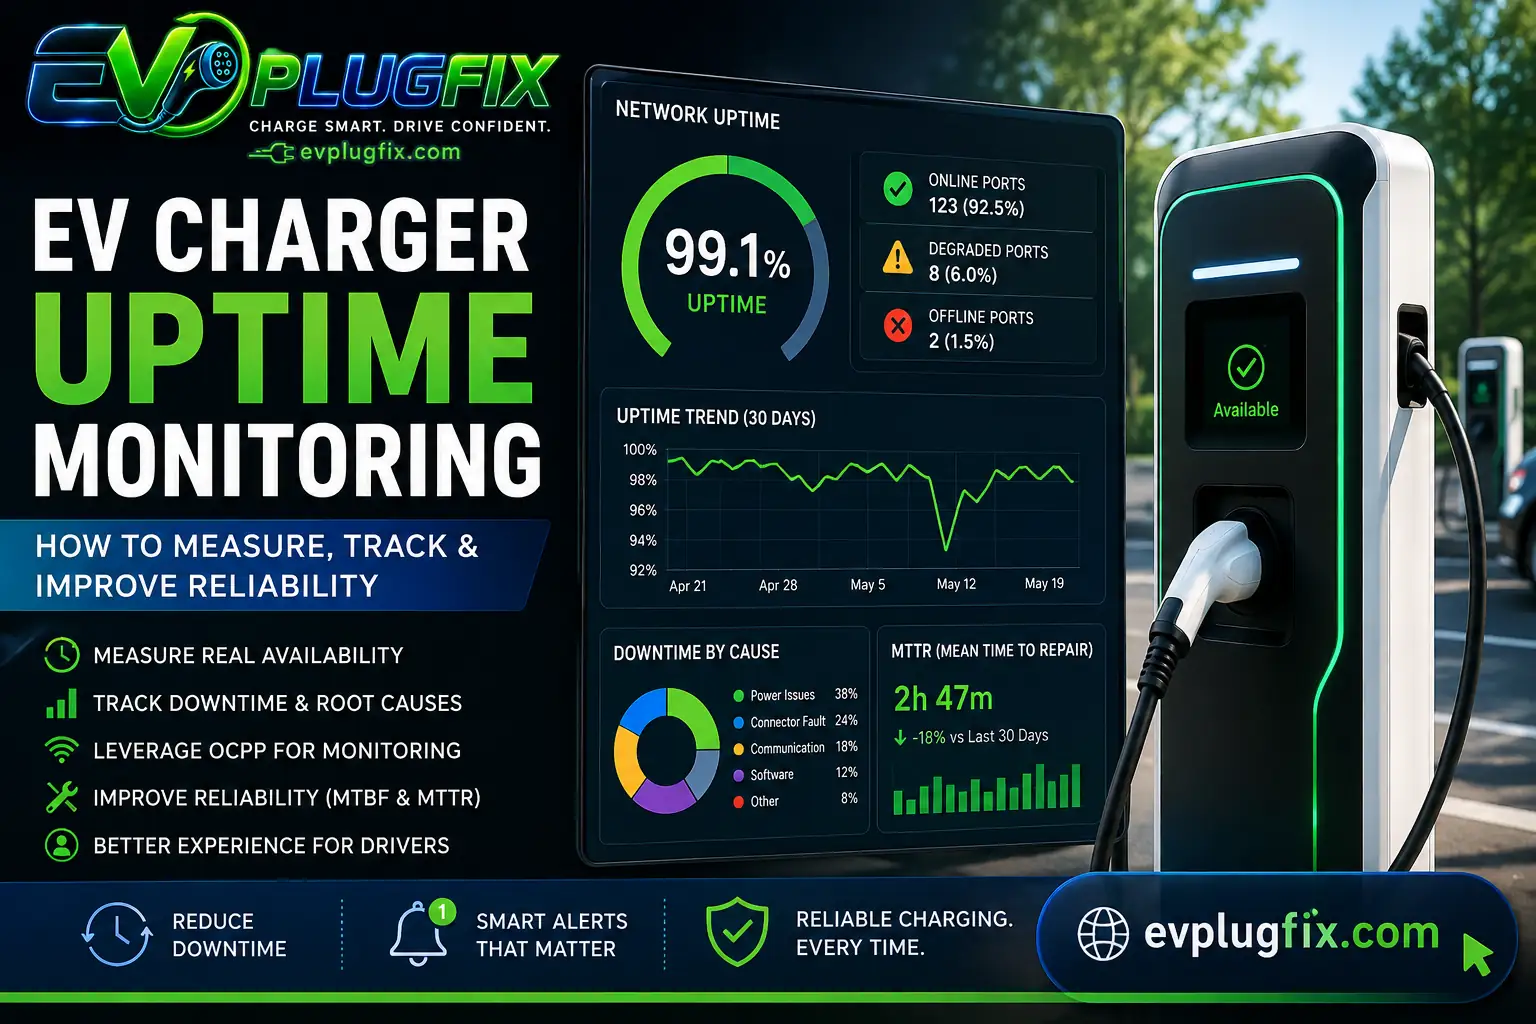
EV charger uptime monitoring should measure whether each charging port can actually serve a driver, not simply whether the charger is connected to the network. A charger can appear online in a management platform while a connector is faulted, authorization fails, power delivery is unavailable, or repeated charging attempts end before energy begins to flow.
That distinction matters at scale. A network showing 99% connectivity can still deliver a poor charging experience if operators are measuring the wrong layer of availability.
This guide explains how to calculate EV charger uptime, what should count as downtime, which OCPP signals can expose problems, and how operators can turn uptime data into faster repairs and more reliable charging sites.
What Is EV Charger Uptime?
EV charger uptime is the percentage of a defined reporting period during which a charging port is operational and capable of providing its intended charging service.
The words operational and capable are important.
A weak uptime measurement may only ask whether the charger is communicating with the charging station management system (CSMS). A stronger measurement asks whether the port is actually available to a driver and capable of delivering energy.
For federally funded charging infrastructure in the United States, the National Electric Vehicle Infrastructure (NEVI) framework uses a port-level definition. A port is considered up when its hardware and software are online and available for use or in use, and the port can successfully dispense electricity according to the applicable requirements.
That is much closer to what drivers care about.
Uptime, Availability and Reliability Are Not the Same Thing
These terms are often used interchangeably, but an operations team should separate them.
| Metric | What It Measures | What It Can Miss |
|---|---|---|
| Connectivity uptime | Whether the charger is communicating with the backend | Connector, payment or power-delivery failures |
| Port availability | Whether a specific port is available for charging | Some failures that only appear when a session begins |
| Session success rate | Whether charging attempts successfully become charging sessions | Periods when nobody attempts to use a broken charger |
| Reliability | How consistently the charger performs its intended function over time | Depends heavily on how the operator defines successful service |
No single metric describes the entire driver experience.
That is why uptime should be analyzed alongside session success, faults, power delivery and repair performance. Our broader EV charging station data analytics guide explains how these measurements fit into a complete network-performance model.
Why “Online” Does Not Mean the Charger Works
This is one of the most common mistakes in charger monitoring.
Imagine a DC fast charger that maintains its network connection for an entire day. Heartbeats continue reaching the CSMS, so a connectivity dashboard shows 100% uptime.
A driver arrives.
The screen works. The connector is physically present. The charger communicates with the backend.
But every charging attempt fails during authorization or the charger cannot initiate power delivery.
From a network-connectivity perspective, the unit is online.
From the driver’s perspective, it is broken.
Operators therefore need several layers of monitoring:
- network connectivity;
- charger and EVSE status;
- connector availability;
- authorization and payment behavior;
- charging-session initiation;
- actual energy delivery;
- fault and error events.
Monitoring only one layer creates blind spots.
How to Calculate EV Charger Uptime
A simple operational uptime calculation is:
Uptime (%) = (Available Time ÷ Total Monitored Time) × 100
For example, suppose a charging port is monitored for 30 days:
30 days × 24 hours = 720 hours
If the port experiences 7.2 hours of qualifying downtime:
(712.8 ÷ 720) × 100 = 99% uptime
The arithmetic is easy.
Defining downtime correctly is harder.
The NEVI Uptime Formula
For charging infrastructure subject to the U.S. NEVI requirements, operators should use the applicable regulatory definition rather than substituting a generic uptime calculation.
The annual port uptime equation is:
μ = ((525,600 − (Toutage − Texcluded)) ÷ 525,600) × 100
Where:
- μ = port uptime percentage;
- Toutage = total outage minutes during the previous year;
- Texcluded = qualifying outage minutes that can be excluded under the applicable rules.
The federal requirement calls for each charging port to achieve average annual uptime greater than 97%.
That 97% figure should not be treated as a universal reliability target for every charger in every country or every commercial agreement. It is a specific regulatory requirement for infrastructure covered by those U.S. rules.
What Counts as EV Charger Downtime?
For internal operational monitoring, downtime should represent periods when the charging service that should be available cannot be delivered.
Depending on the network and reporting framework, causes may include:
- charger hardware failure;
- connector or cable faults;
- internal communication problems;
- software crashes;
- unrecoverable firmware problems;
- payment or authorization failures that prevent charging;
- contactor or power-module faults;
- thermal shutdowns;
- loss of backend communication where the charger cannot continue operating independently;
- other conditions that make a port unavailable to drivers.
Operators should record both the duration and cause.
“Port unavailable for 190 minutes” tells you how much service was lost.
“Port unavailable for 190 minutes because of repeated isolation faults” tells you what to investigate.
What Downtime Can Be Excluded?
This depends on the reporting standard, contract or regulation being used.
Under the federal NEVI uptime calculation, certain outage periods outside the charging station operator’s control can be excluded when the required conditions are met. Examples include utility service interruptions, qualifying vehicle-side failures, scheduled maintenance, vandalism and natural disasters. Hours outside the station’s identified operating hours can also be excluded under the federal calculation.
Do not quietly remove inconvenient outages from an internal dashboard.
Maintain at least three fields:
- total outage time;
- excluded outage time;
- reason for exclusion.
This keeps the calculation auditable and prevents two teams from reporting different uptime numbers for the same charger.
99% Uptime Still Allows More Downtime Than It Sounds
High percentages can hide meaningful service loss.
Using a 365-day year with no exclusions, the approximate maximum downtime associated with several uptime levels is:
| Uptime | Approx. Downtime per Year | Approx. Downtime per 30 Days |
|---|---|---|
| 97% | 262.8 hours | 21.6 hours |
| 98% | 175.2 hours | 14.4 hours |
| 99% | 87.6 hours | 7.2 hours |
| 99.5% | 43.8 hours | 3.6 hours |
| 99.9% | 8.76 hours | 43.2 minutes |
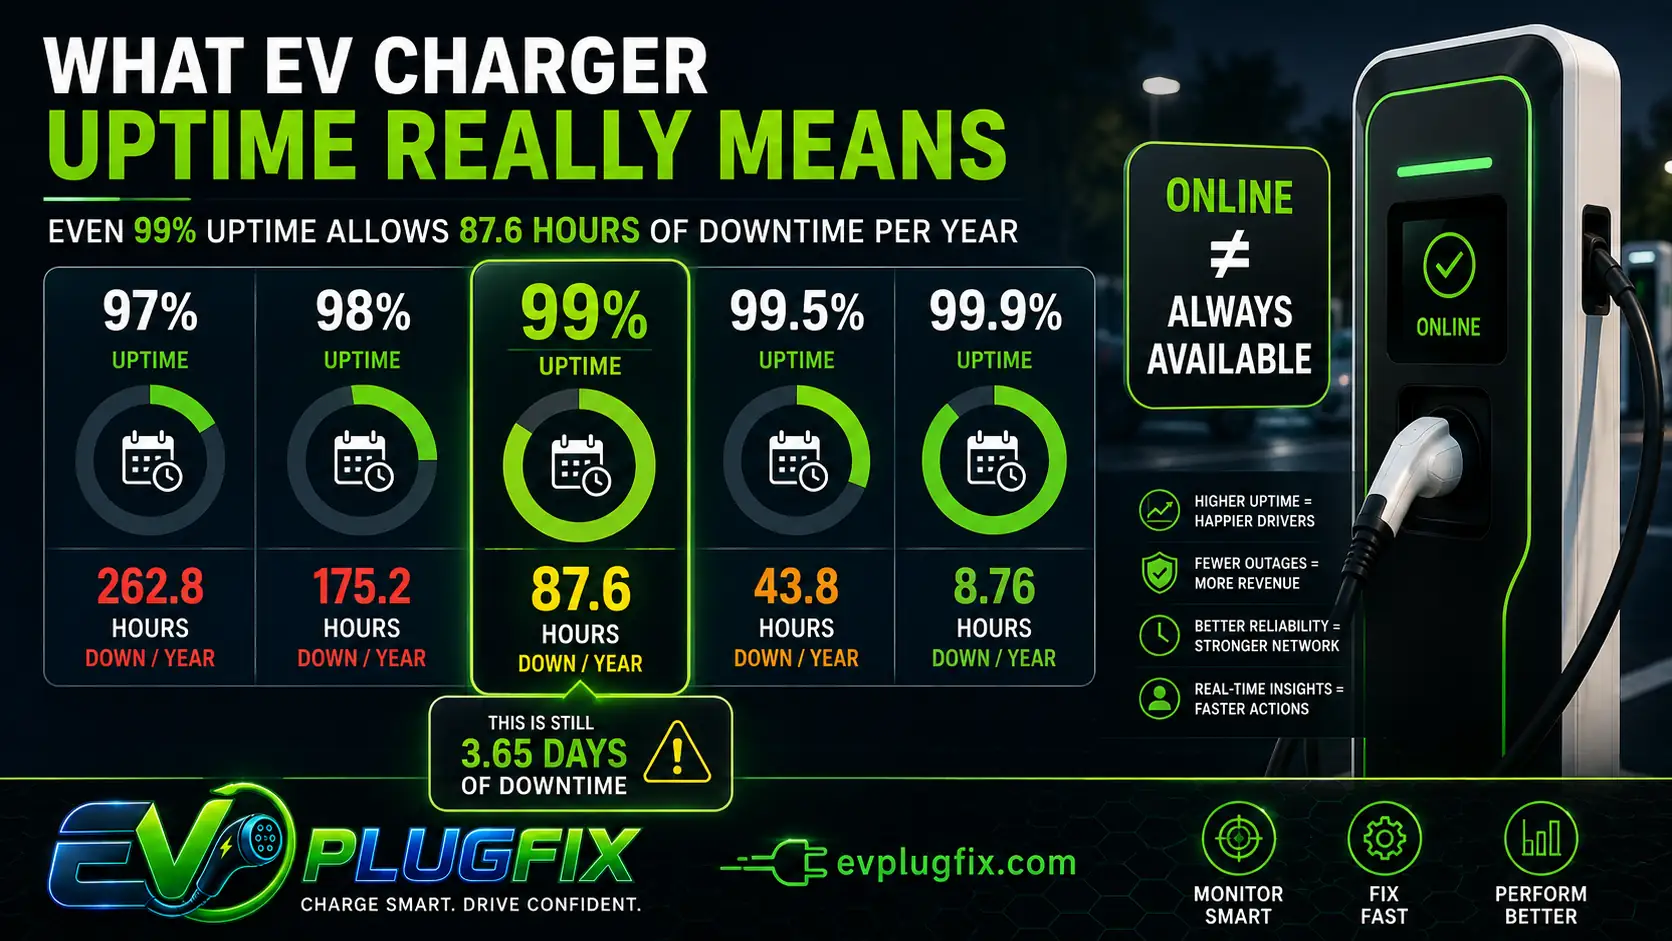
These are simple mathematical illustrations, not regulatory calculations with excluded downtime.
They show why another decimal place matters.
For a busy highway charging location, 87.6 hours of annual downtime on one port can represent many missed charging opportunities.
Measure Uptime per Port, Not Just per Station
A four-port charging station creates an obvious reporting problem.
If three ports work and one is faulted, is the station up?
A station-level binary metric could say yes.
Drivers waiting for the failed connector may disagree.
Port-level monitoring gives operators much better information because each connector can develop its own:
- fault history;
- session-success rate;
- downtime duration;
- utilization pattern;
- repair history;
- power-delivery behavior.
Site-level and network-level uptime can still be useful for executive reporting, but operations teams should preserve the underlying port-level data.
How OCPP Helps Monitor EV Charger Uptime
OCPP provides a standardized communication layer between a charging station and its management system. It does not make a charger reliable by itself.
What it can do is expose information that allows an operator to detect problems earlier.
The Open Charge Alliance has published specific guidance on improving uptime monitoring with OCPP. The guidance describes using OCPP messages and configuration options to identify conditions that may lead to charger downtime and, in some cases, respond before a driver encounters the failure.
Charger → OCPP Events → CSMS → Fault Classification → Alert → Remote Action or Maintenance
The video above is an Open Charge Alliance session featuring Benny Varghese of Idaho National Laboratory on how OCPP and error codes can help improve charging-infrastructure uptime.
Connectivity and Heartbeats
The first question is basic: can the charger communicate with the CSMS?
A lost WebSocket connection or missing expected communication can indicate that the backend has lost visibility of the charger.
Heartbeat monitoring can help identify communication loss, but a missing heartbeat should not automatically be labeled a hardware failure. The underlying problem could involve:
- cellular connectivity;
- local networking;
- router or modem hardware;
- the CSMS connection;
- charger software;
- site power.
The alert should begin diagnosis, not pretend to finish it.
OCPP 1.6 Status and Error Monitoring
In OCPP 1.6 environments, StatusNotification messages provide useful information about connector status and can include error information when a fault occurs.
Operators should not simply count every error code.
Record:
- when the fault began;
- which connector or EVSE was affected;
- the reported error;
- how long the condition persisted;
- whether it cleared automatically;
- whether a remote action was required;
- whether the fault returned later.
A fault that appears for two seconds once a month is different from one that repeatedly disables the same port for hours.
OCPP 2.0.1 Monitoring
OCPP 2.0.1 introduced a more detailed device model and stronger monitoring capabilities than OCPP 1.6, allowing the CSMS to work with a more structured representation of charging-station components and variables.
For uptime operations, that can provide more diagnostic context than a simple “Faulted” state.
The goal is not to collect every possible message forever.
The goal is to identify signals that answer operational questions:
What failed? When did it fail? Is the charger still usable? Can the problem be fixed remotely? Is this fault becoming more frequent?
Monitor More Than OCPP Status
Protocol messages are only part of an uptime system.
A useful monitoring stack may combine:
- OCPP status and events;
- charger connectivity;
- charging-session records;
- meter values;
- power-delivery data;
- payment and authorization outcomes;
- remote-command results;
- maintenance tickets;
- technician findings;
- driver reports.
This is how operators catch failures that a single status field misses.
Detect “Ghost Availability”
One of the most damaging monitoring failures occurs when a charger appears available in software but cannot complete the service a driver expects.
Call it ghost availability.
Typical patterns include:
- the port repeatedly reports available but sessions fail to start;
- authorization succeeds but energy never begins flowing;
- the charger repeatedly resets during session initiation;
- power remains far below expected levels because of a persistent internal fault;
- a payment terminal problem prevents public users from beginning a session while the charger itself reports no major power fault.
A basic uptime dashboard may miss these conditions.
Cross-checking availability with session and power data is much stronger.
Session Success Rate Is the Best Companion to Uptime
Suppose Charger A reports 99.8% uptime.
Looks excellent.
Now suppose 8% of valid charging attempts fail before meaningful energy is delivered.
The uptime number is no longer enough to describe performance.
Session success rate asks a different question:
When a driver tries to charge, how often does charging actually begin successfully?
That makes it a useful companion metric for detecting problems hidden behind an apparently healthy uptime percentage.
When the two metrics disagree, investigate.
| Uptime | Session Success | Likely Interpretation |
|---|---|---|
| High | High | Charger is probably performing well |
| High | Low | Availability metric may be hiding transaction, payment, vehicle-handshake or power-delivery problems |
| Low | High | Charger works well when available but experiences excessive outages |
| Low | Low | Major reliability investigation required |
Use MTBF and MTTR to Explain the Uptime Number
Two charging networks can report the same uptime and have completely different maintenance problems.
Network A experiences infrequent failures that take technicians a long time to repair.
Network B experiences many small failures that are restored quickly.
The uptime percentage may look similar.
The operational strategy should not.
Mean Time Between Failures
MTBF helps describe how long an asset typically operates between qualifying failures.
Falling MTBF can indicate that a charger or component is becoming less reliable even before annual uptime deteriorates dramatically.
Mean Time to Repair
MTTR measures how long restoration takes after a failure.
High MTTR may point to:
- slow fault detection;
- poor remote diagnostics;
- parts shortages;
- technician availability;
- long travel distances;
- unclear maintenance ownership;
- repeat site visits because the first repair did not address the root cause.
Improving uptime therefore has two sides:
Fail less often. Recover faster when failure occurs.
Classify Downtime by Root Cause
A network-wide uptime percentage tells management whether performance is improving or declining.
It does not tell the maintenance team what to fix.
Every meaningful outage should eventually fall into a useful root-cause category.
| Category | Examples |
|---|---|
| Power | Breaker, supply, power module, contactor |
| Communication | Cellular, Ethernet, modem, backend connection |
| Connector | Cable, plug, latch, temperature sensor |
| Software | Firmware crash, boot loop, configuration problem |
| Payment | Terminal, authorization or payment-service failure |
| Vehicle interaction | Handshake or compatibility-related failure |
| Thermal | Overtemperature, cooling-system problem, derating |
| External | Utility outage, vandalism, natural disaster |
Do not stop at “other” unless you genuinely do not know.
If 35% of network downtime is permanently classified as unknown, the monitoring system is recording outages without producing enough diagnostic value.
Build an EV Charger Uptime Dashboard for Operations
The best dashboard is not the one with the most charts.
It is the one that tells an operator where attention is needed.
A practical network view should include:
- network uptime;
- site uptime;
- port-level uptime;
- current unavailable ports;
- outage duration;
- session success rate;
- MTBF;
- MTTR;
- repeat fault rate;
- unreachable chargers;
- top downtime causes;
- open maintenance incidents.
Rank Problems by Lost Service, Not Just Fault Count
A charger generating 50 harmless transient events should not automatically outrank a charger that has been unusable for six hours.
Prioritize incidents using factors such as:
- current service impact;
- number of unavailable ports;
- outage duration;
- site utilization;
- availability of nearby working ports;
- repeat-failure history;
- commercial importance of the location.
This converts monitoring from alarm collection into operational decision-making.
Set Alerts That Lead to Action
Alert fatigue destroys monitoring systems.
If every transient warning generates a high-priority ticket, operators eventually stop trusting the alerts.
A better alerting strategy uses persistence, severity and context.
Examples:
- Communication alert: charger unreachable beyond an expected heartbeat or connection threshold;
- availability alert: port remains unavailable beyond a defined period;
- repeat-fault alert: same critical fault occurs several times within a rolling window;
- session alert: repeated failed starts exceed the site’s normal baseline;
- power alert: delivered power remains abnormally low across comparable sessions;
- thermal alert: temperature behavior repeatedly approaches a protective threshold;
- site alert: multiple ports fail simultaneously, suggesting a shared upstream problem.
The best alert tells the operator three things:
What happened, how serious it is, and what should happen next.
Remote Recovery Can Cut Downtime Dramatically
Not every charger problem requires a truck roll.
Depending on the charger, protocol implementation and fault condition, an operations team may be able to:
- restart or reset the charging station;
- change configuration;
- update firmware;
- clear a recoverable software condition;
- re-establish communication;
- disable an unsafe or malfunctioning port while leaving other ports operational.
Remote recovery matters because repair time begins when the service fails, not when a technician arrives.
If an issue can safely be diagnosed and restored in minutes from a network operations center, waiting several hours for an on-site visit unnecessarily increases MTTR.
Remote resets should not become a substitute for root-cause analysis, however.
If the same charger needs to be rebooted every three days, the reboot is masking a reliability problem rather than solving it.
Use Uptime Monitoring for Preventive Maintenance
Traditional maintenance reacts to a failure.
Better monitoring looks for deterioration before complete failure.
Suppose one fast charger begins showing:
- more frequent temperature warnings;
- increasing power derating;
- short communication interruptions;
- several recoverable faults;
- a falling interval between incidents.
The charger may still have excellent headline uptime.
But its behavior has changed.
That makes it a candidate for inspection before the next event becomes a prolonged outage.
This is where uptime monitoring connects directly with predictive maintenance: historical operating data can reveal degradation that a simple online/offline status cannot.
Multi-Vendor Networks Need Normalized Reliability Data
Monitoring becomes harder when a charging network uses hardware from several manufacturers.
Different chargers may expose different diagnostic detail, use vendor-specific codes, implement optional protocol features differently, or describe similar failures in different ways.
The analytics layer should normalize those differences into operational categories.
For example:
Vendor-specific fault → standardized fault family → severity → affected component → recommended workflow
Keep the original raw error as well.
Normalization makes fleet-wide comparisons possible without throwing away the detail technicians may need later.
Do Not Hide Low-Traffic Charger Failures
Session data alone has another blind spot.
A busy charger that fails will quickly generate unsuccessful attempts and customer complaints.
A remote charger may sit broken for days before anybody tries to use it.
Low utilization does not make that charger reliable.
This is why continuous state and connectivity monitoring must complement driver-session analytics.
Common EV Charger Uptime Monitoring Mistakes
Reporting Only Network Connectivity
A connected charger is not automatically a usable charger.
Calculating Only Site-Level Uptime
One working port can hide several failed ports when the entire location is treated as a single binary asset.
Ignoring Failed Session Starts
A charger can report available while repeatedly disappointing drivers.
Using Different Downtime Definitions Across Teams
Operations, management and external reporting should not produce incompatible numbers from the same events.
Excluding Downtime Without Recording Why
Every exclusion should have a defensible reason and an auditable time period.
Measuring Fault Counts Without Fault Duration
One six-hour failure can matter more than dozens of short recoverable warnings.
Resetting Chargers Without Investigating Repeat Failures
Remote recovery is useful. Repeated recovery without root-cause correction is technical debt.
Waiting for Customer Complaints
Drivers should not be the monitoring system.
A Practical Uptime Monitoring Workflow
A mature process can be surprisingly straightforward:
- Collect charger status, connectivity, session, power and fault data.
- Normalize events across charger models and software versions.
- Determine service state at port level.
- Detect outages and record exact start and restoration times.
- Classify causes and permitted exclusions separately.
- Correlate uptime with session success and power delivery.
- Alert when failures require intervention.
- Attempt safe remote recovery where appropriate.
- Escalate unresolved incidents to maintenance.
- Verify that the charger actually works after restoration.
- Review repeat failures rather than closing incidents permanently after the first reset.
The last two steps are easy to overlook.
A ticket being closed does not prove the charger has returned to reliable service.
What Is a Good EV Charger Uptime Target?
There is no single percentage that defines good performance for every charging network.
The correct target depends on regulatory requirements, service-level agreements, charger type, site importance and operating model.
For U.S. charging infrastructure covered by the NEVI minimum standards, each charging port must achieve average annual uptime greater than 97% under the specified calculation.
Operators may choose stricter internal targets.
That makes sense because a regulatory minimum and a commercial reliability goal are not necessarily the same thing.
A high-utilization fast-charging hub may justify aggressive uptime and repair targets because every unavailable port directly affects throughput, queues and revenue.
Frequently Asked Questions
What is EV charger uptime?
EV charger uptime measures the percentage of a reporting period during which a charger or charging port is operational and capable of providing charging service according to the definition being used.
How do you calculate EV charger uptime?
A basic calculation divides available operating time by total monitored time and multiplies the result by 100. Regulatory programs may use specific formulas and permitted downtime exclusions, so operators should use the applicable definition when reporting compliance.
Is 97% uptime required for all EV chargers?
No. The greater-than-97% annual port uptime requirement is associated with U.S. charging infrastructure covered by the NEVI standards and should not be presented as a universal requirement for every charger or jurisdiction.
Does an online EV charger count as available?
Not necessarily. Backend connectivity confirms communication, but the charger may still have connector, payment, authorization, power-delivery or session-initiation problems that prevent a driver from charging.
Should uptime be measured per charger or per port?
Port-level measurement provides more useful operational detail because individual ports on the same station can have different availability and fault histories. Some regulatory frameworks, including NEVI, explicitly calculate uptime at port level.
Can OCPP monitor EV charger uptime?
OCPP can provide status, connectivity, event and diagnostic information that helps a CSMS detect conditions associated with downtime. OCPP itself does not guarantee uptime; operators must interpret the data and respond appropriately.
What is the difference between uptime and session success rate?
Uptime measures how much time a port is operational according to a defined availability rule. Session success rate measures whether actual charging attempts successfully become charging sessions. Using both exposes failures that either metric can miss alone.
How can EV charger downtime be reduced?
Operators can reduce downtime through continuous port-level monitoring, meaningful alerts, remote diagnostics, fast incident escalation, spare-parts planning, preventive maintenance, repeat-fault analysis and verification after repairs.
Bottom Line
EV charger uptime monitoring works only when the metric reflects real charging service.
Do not stop at “online.”
Measure availability at port level, track outages by duration and root cause, correlate status with actual charging attempts, and use OCPP data to detect problems before a driver has to report them.
Then use MTBF to understand how often equipment fails and MTTR to understand how quickly the network recovers.
The result is more than a better uptime percentage. It is an operating system for finding unreliable chargers, prioritizing maintenance and keeping more connectors ready when drivers need them.