
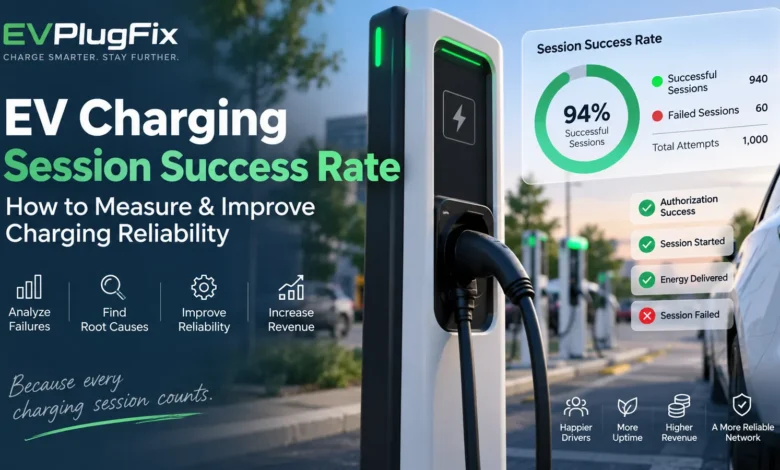
An EV charger can be online, connected to its charging network, and still fail to deliver a successful charging session.
That distinction is becoming increasingly important for EV charging operators, fleet managers, site hosts, and charging network providers. A charger that appears available on a dashboard may still reject an authorization request, fail to establish communication with the vehicle, stop before energy is delivered, or experience a backend transaction error.
This is why EV charging session success rate is an important operational metric.
Unlike simple uptime measurements, session success rate looks at what actually happens when a driver attempts to charge.
A reliable charging network should therefore measure not only whether chargers are online, but also whether drivers can successfully start and receive energy from charging sessions.
What Is EV Charging Session Success Rate?
EV charging session success rate is the percentage of charging attempts that successfully reach an operator-defined successful charging condition.
The basic formula is:
Session Success Rate = Successful Charging Sessions ÷ Total Charging Attempts × 100
For example, if a charging site receives 1,000 valid charging attempts during a month and 940 successfully begin charging, the session success rate is:
940 ÷ 1,000 × 100 = 94%
The important part is defining what counts as a successful session.
One operator may define success as authorization followed by session start. Another may require measurable energy delivery. A more advanced charging network may distinguish successful starts from sessions that terminate unexpectedly.
Whatever definition is selected, it should remain consistent so that performance can be compared over time.
Why Session Success Rate Matters
A charging station can report excellent uptime while providing a poor customer experience.
For example:
- Charger uptime: 99%
- Availability: 98%
- Session success rate: 89%
The equipment may be technically operational most of the time, but 11 out of every 100 charging attempts fail according to the operator’s definition.
From the driver’s perspective, that is a reliability problem.
The EV charging station data analytics guide explains why operators need to analyze charging-session records alongside charger status, faults, meter readings, utilization, and other operational data.
Uptime vs Availability vs Session Success Rate
These metrics are related, but they are not interchangeable.
| Metric | What It Measures | Main Question |
|---|---|---|
| Uptime | How long equipment remains operational | Is the charger functioning? |
| Availability | Whether a connector is available for use | Can a driver theoretically use it? |
| Utilization | How heavily the charger is being used | How much is the asset being used? |
| Session Success Rate | How often charging attempts successfully start or deliver energy | Did the charging attempt actually work? |
| Session Completion Rate | How often started sessions reach the defined completion condition | Did the session finish normally? |
For a deeper discussion of the difference between uptime, availability and charging reliability, see our guide to EV Charger Uptime Monitoring.
Why 99% Uptime Does Not Guarantee Reliable Charging
Uptime primarily tells an operator whether equipment was operational during a defined period. It does not necessarily tell the operator whether every charging attempt succeeded.
Imagine a DC fast charger that maintains its connection with the charging management system throughout the day. Its dashboard shows that it is online.
A driver arrives and starts a charging attempt.
The charger may then fail because of authorization, communication, connector, payment, vehicle, configuration, or power-delivery problems.
The charger was online.
The charging experience still failed.
This is why modern charging analytics should connect equipment status with individual charging sessions.
How to Define a Successful EV Charging Session
There is no single definition that works for every charging network.
A practical definition could be:
A charging attempt is successful when authorization is accepted, the charging session starts, and measurable energy is delivered to the vehicle.
This definition prevents an operator from counting a session as successful simply because the backend accepted the driver’s credentials.
For advanced analytics, divide the charging journey into stages:
- Charging attempt
- Authorization
- Vehicle and charger connection
- Session start
- Energy delivery
- Session completion
Each stage creates an opportunity to identify where charging reliability breaks down.
A Better EV Charging Session Success Formula
Authorization Success Rate
Successful Authorizations ÷ Authorization Attempts × 100
This metric can expose payment, RFID, account, roaming, or backend authorization problems.
Session Start Success Rate
Successful Session Starts ÷ Valid Charging Attempts × 100
This focuses on failures that occur after an attempt has been initiated but before the charging session becomes active.
Energy Delivery Success Rate
Sessions Delivering Energy ÷ Valid Charging Attempts × 100
This is often closer to the driver’s actual experience because it confirms that the charger delivered measurable energy.
Session Completion Rate
Normally Completed Sessions ÷ Started Sessions × 100
This identifies sessions that start successfully but terminate unexpectedly.
The EV Charging Reliability Funnel
A useful charging analytics system can visualize charging attempts as a funnel:
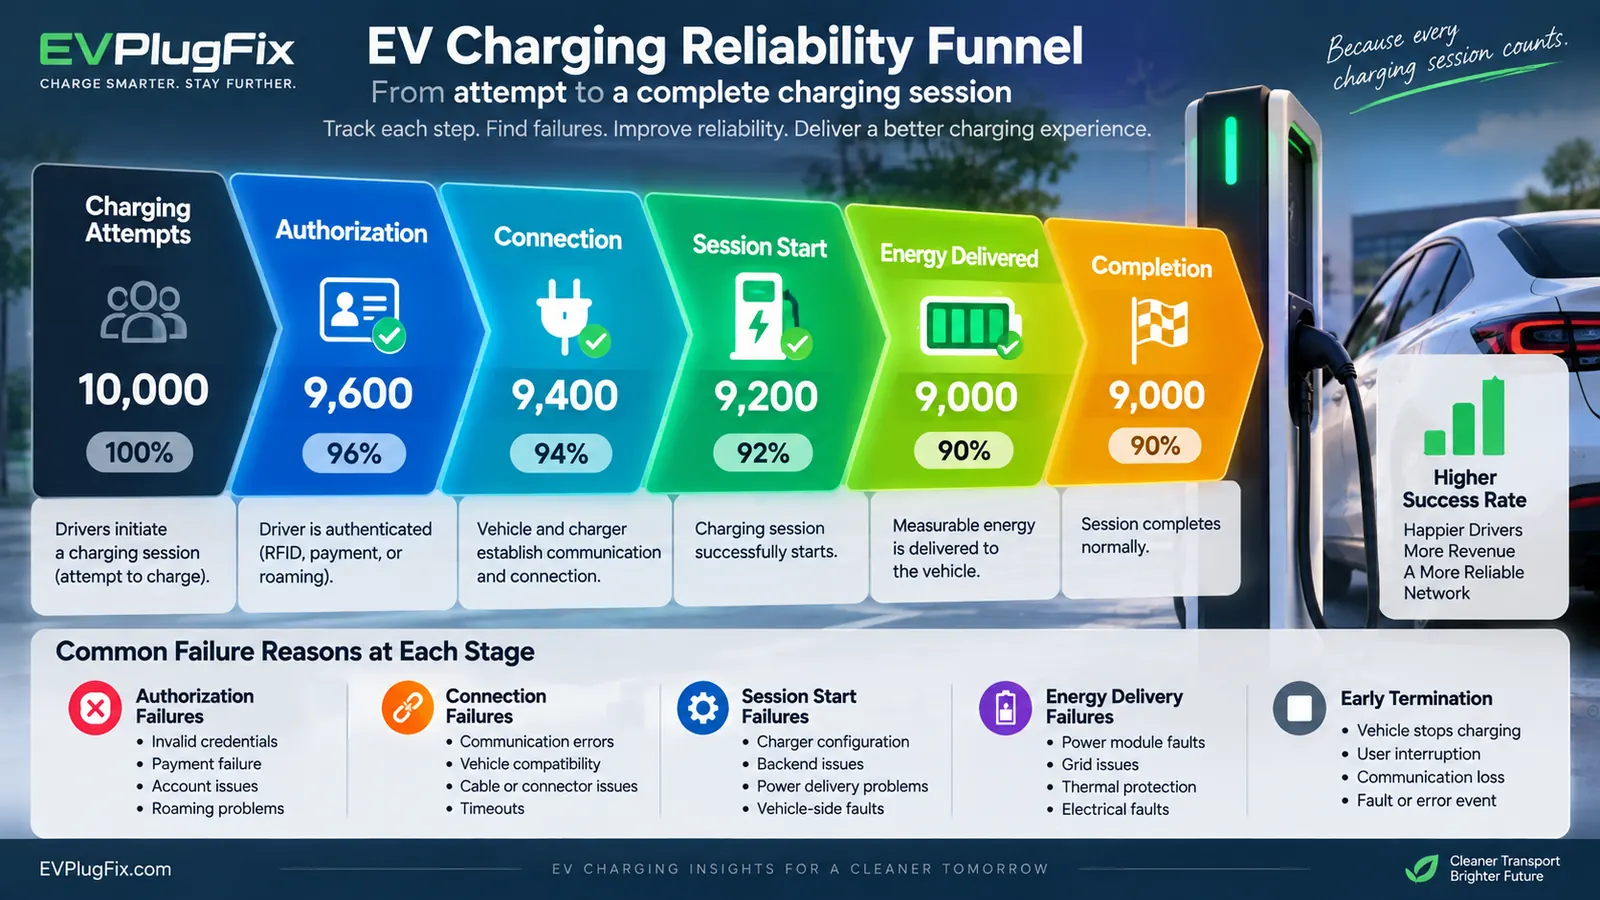
Charging Attempts → Authorization → Connection → Session Start → Energy Delivery → Completion
Suppose a network records 10,000 charging attempts:
| Stage | Successful Events | Rate |
|---|---|---|
| Charging attempts | 10,000 | 100% |
| Authorized | 9,600 | 96% |
| Sessions started | 9,400 | 94% |
| Energy delivered | 9,200 | 92% |
| Normally completed | 9,000 | 90% |
This immediately shows where charging opportunities are being lost.
What Causes EV Charging Session Failures?
1. Authorization Failures
A charging session may fail before charging begins because the driver cannot be authorized.
- Invalid RFID credentials
- Expired account
- Payment authorization failure
- Roaming authorization problem
- Backend communication issue
- Incorrect configuration
- Authorization timeout
2. OCPP Communication Problems
The Open Charge Point Protocol (OCPP) provides communication between charging stations and charging station management systems.
Communication problems can affect:
- Authorization
- Transaction processing
- Status reporting
- Remote commands
- Metering data
- Session events
- Fault reporting
OCPP 2.0.1 introduced a unified TransactionEvent approach for transaction-related reporting. This makes transaction-event data especially useful when investigating how a charging session progressed or where it stopped.
Learn more about OCPP from the Open Charge Alliance.
OCPP Transaction Data and Failed Charging Sessions
For networked charging stations, OCPP data can help operators reconstruct what happened during a failed charging attempt.
Depending on the OCPP version and implementation, operators can analyze information associated with:
- Authorization
- Transaction start
- Transaction stop
- Meter values
- Connector status
- Error events
- Charging state
- Communication events
OCPP 2.0.1 uses TransactionEvent messages to consolidate transaction-related reporting. The Open Charge Alliance provides additional technical documentation explaining the transaction mechanisms in OCPP 1.6 and OCPP 2.0.1.
Read the Open Charge Alliance OCPP 2.0.1 transaction documentation.
Watch: OCPP Transaction Mechanisms
Understanding how charging transactions are communicated between a charging station and its backend can make failed-session analysis much easier.
This Open Charge Alliance webinar explains transaction mechanisms in OCPP 1.6 and OCPP 2.0.1 and is particularly relevant to understanding charging-session events.
Track Session Success Rate by Connector
Network-wide averages can hide individual connector problems.
| Connector | Attempts | Successful | Success Rate |
|---|---|---|---|
| A | 500 | 485 | 97.0% |
| B | 510 | 496 | 97.3% |
| C | 490 | 401 | 81.8% |
| D | 520 | 508 | 97.7% |
Connector C immediately deserves investigation.
Instead of troubleshooting the entire location, the operator can examine the specific connector’s fault history, OCPP events, payment records, cable condition, temperature data, firmware version, and maintenance history.
Track Session Success Rate by Location
The same methodology should be applied across charging sites.
A network may discover that:
- Highway locations have lower session success rates.
- One city has unusually high authorization failures.
- A particular site experiences repeated failures during peak periods.
- One charger model performs worse than comparable hardware.
- A specific location has unusually high communication failures.
Geographic segmentation can reveal patterns that disappear inside a network-wide average.
Track Session Success Rate by Time
Time-based analysis can reveal problems that are invisible in monthly reporting.
Calculate session success rate by:
- Hour
- Day of week
- Week
- Month
- Peak and off-peak periods
- Maintenance windows
For example, a charger could have a 97% weekly success rate but fall to 82% during a four-hour peak period.
That pattern could indicate capacity limitations, backend problems, thermal behavior, network congestion, or other conditions that only appear under heavier demand.
Session Success Rate and Revenue
Charging reliability also has a commercial impact.
Consider a simplified example:
- 10,000 monthly charging attempts
- Average revenue per successful session: $8
- Current success rate: 90%
At a 90% success rate:
9,000 × $8 = $72,000
If the network improves the success rate to 96% without increasing the number of attempts:
9,600 × $8 = $76,800
That is a potential difference of $4,800 per month in this simplified example.
Actual revenue depends on pricing, energy delivered, session duration, utilization, fees, electricity costs, and other commercial factors.
Build an EV Charging Session Failure Taxonomy
Do not put every failed charging session into a single “Unknown Error” category.
A useful taxonomy can include:
| Category | Examples |
|---|---|
| Authentication | Invalid credential, authorization rejected, account problem |
| Payment | Payment authorization failure, payment terminal problem |
| Communication | CSMS unavailable, timeout, charger offline |
| Vehicle | Vehicle-side communication or charging problem |
| Connector | Cable, locking, connector or contact problems |
| Hardware | Power module, cooling, controller or internal fault |
| Electrical | Power interruption, protection event, voltage/current issue |
| Configuration | Incorrect charger or backend configuration |
| Unknown | Insufficient diagnostic information |
The Unknown category should itself be monitored. If a large percentage of failures have no identifiable cause, the network may have a data-quality problem.
Measure Session Success Rate Per EVSE
Operators should preserve enough data to drill down from:
Network → Site → EVSE → Connector → Charging Session
This hierarchical approach is much more useful than a single network-wide percentage.
For example, a network could have a 96% overall session success rate while one connector consistently performs at 80%.
The aggregate number looks healthy.
The individual connector needs attention.
Use Rolling Averages Instead of Single Measurements
A single failed session should not necessarily trigger a maintenance ticket.
Instead, monitor:
- 1-hour success rate
- 24-hour success rate
- 7-day success rate
- 30-day success rate
Suppose a charger shows:
- 30-day rate: 97%
- 7-day rate: 93%
- 24-hour rate: 86%
This trend suggests deterioration and deserves investigation.
How to Improve EV Charging Session Success Rate
1. Identify the Failure Stage
Determine whether the problem occurs during authorization, connection, session initiation, energy delivery, or session completion.
2. Segment the Data
Break failures down by charger, connector, location, time, charger model, firmware, payment method, vehicle information when available, and failure category.
3. Find Repeat Failures
Repeated failures on the same connector are often more actionable than hundreds of unrelated failures.
4. Monitor Communication Health
Look for repeated disconnects, delayed responses, reconnection events, missing transaction events, and backend communication failures.
5. Prioritize Maintenance
Maintenance teams should prioritize assets with:
- Low session success rates
- High repeat-failure rates
- High customer impact
- High utilization
- Long repair times
6. Validate Firmware and Configuration
If failures begin immediately after a firmware or configuration change, compare performance before and after the change.
7. Measure the Result of Repairs
A repair should not be considered successful simply because the fault disappears. Measure whether the connector’s session success rate actually improves afterward.
Combine Session Success Rate With Uptime
The strongest charging reliability analysis combines both metrics.
| Charger | Uptime | Session Success Rate | Interpretation |
|---|---|---|---|
| A | 99% | 98% | Healthy |
| B | 92% | 91% | General reliability problem |
| C | 99% | 82% | Online but poor session reliability |
| D | 93% | 98% | Usually reliable when online |
Charger C is particularly interesting. Its uptime is excellent, but its session success rate is poor.
This suggests that the problem may exist between the charger being online and the charging session successfully delivering energy.
Our EV Charger Uptime Monitoring guide covers the complementary reliability metrics that should be evaluated alongside session success.
Session Success Rate vs Utilization
These metrics should also be analyzed together.
| Utilization | Session Success | Possible Interpretation |
|---|---|---|
| High | Low | High demand but significant lost charging opportunities |
| Low | High | Reliable infrastructure but limited demand |
| High | High | Potentially strong-performing asset |
| Low | Low | Demand and reliability both require investigation |
EV Charging Reliability Dashboard
A practical charging reliability dashboard should include more than one percentage.
Primary KPIs
- Overall Session Success Rate
- Session Start Success Rate
- Energy Delivery Success Rate
- Session Completion Rate
- Charging Attempts
- Failed Sessions
Reliability KPIs
- Uptime
- Availability
- MTTR
- Repeat Failure Rate
- Fault Frequency
Diagnostic KPIs
- Authorization Failures
- Payment Failures
- Communication Failures
- Hardware Failures
- Vehicle-Related Failures
- Unknown Failures
Each top-level KPI should ideally allow operators to drill down to the site, EVSE, connector, and individual charging session.
What Is a Good EV Charging Session Success Rate?
There is no universal percentage that should automatically be labeled “good.”
The appropriate benchmark depends on charger type, location, vehicle mix, payment architecture, OCPP implementation, roaming relationships, data quality, and the operator’s definition of a successful session.
Operators should therefore establish a reliable baseline and measure changes over time.
More useful than asking:
“Is 95% good?”
is asking:
“Is this charger improving or deteriorating, and how does it compare with similar chargers under similar conditions?”
Common Mistakes When Measuring Session Success
- Using uptime as a substitute: A charger can be online while individual charging attempts fail.
- Using only network averages: Aggregate data can hide a failing connector.
- Counting authorization as charging success: Authorization does not prove that energy was delivered.
- Ignoring failed attempts: Successful sessions alone cannot show the true failure rate.
- Overusing the Unknown category: Poor failure classification can hide systematic problems.
- Changing the definition: Changing the success criteria makes historical comparisons unreliable.
- Ignoring the vehicle: Not every charging failure originates in the charger.
How to Build a Session-Level EV Charging Dataset
For advanced analytics, each charging attempt should ideally contain:
- Session ID
- Charger ID
- EVSE ID
- Connector ID
- Site ID
- Timestamp
- Authorization result
- Connection state
- Session start result
- Session end result
- Energy delivered
- Charging duration
- Error code
- Failure category
- OCPP version
- Firmware version
- Payment method
- Vehicle information when legitimately available
With these fields, operators can move from simple reporting to root-cause analysis.
Frequently Asked Questions
What is EV charging session success rate?
EV charging session success rate measures the percentage of charging attempts that reach a predefined successful charging outcome. The exact definition should be established by the charging operator.
How do you calculate EV charging session success rate?
Use Successful Charging Sessions ÷ Total Charging Attempts × 100. The operator must first define what constitutes a successful session.
Is session success rate the same as charger uptime?
No. Uptime measures equipment operational time, while session success rate measures whether charging attempts actually achieve the defined successful outcome.
Why can a charger have high uptime but a low session success rate?
A charger can remain online while individual attempts fail because of authorization, payment, communication, connector, vehicle, configuration, or power-delivery problems.
Should session success rate be measured per charger?
Yes. Measuring it per EVSE and connector can reveal underperforming assets that network-wide averages may hide.
Can OCPP help analyze failed charging sessions?
Yes. OCPP transaction and charging-station data can help operators reconstruct session behavior and investigate failures. OCPP 2.0.1 introduced the TransactionEvent approach for transaction-related reporting.
What is the best way to improve session success rate?
Start by identifying the stage where failures occur, segment failures by charger and connector, analyze recurring causes, and then prioritize maintenance, configuration, software, communication, or hardware improvements based on the evidence.
Should EV charging operators track session completion rate too?
Yes. Session completion rate complements session start success rate by showing how often sessions that begin reach the operator’s defined normal completion condition.
Final Takeaway
EV charging session success rate is one of the most useful metrics for measuring real-world charging reliability.
Uptime answers:
“Was the charger operational?”
Availability asks:
“Could the charger be used?”
Session success rate asks the more customer-focused question:
“Did the charging attempt actually work?”
For commercial EV charging networks, the strongest approach is to monitor these metrics together.
The complete charging journey should be measurable:
Attempt → Authorization → Connection → Session Start → Energy Delivery → Completion
Operators can then segment failures by charger, connector, location, time, firmware, communication layer, payment method, and failure category.
This allows charging networks to move beyond simply knowing that a charger failed.
They can determine where, when, how often, and why charging sessions fail—and which actions are most likely to improve reliability.
That distinction is increasingly important as EV charging networks scale and operators compete on both uptime and customer experience.
Technical References
- U.S. Department of Energy — Charging Networks
- U.S. Department of Energy — EV Charging Infrastructure Maintenance and Operation
- Open Charge Alliance — OCPP Protocols
- Open Charge Alliance — New in OCPP 2.0.1
Related EVPlugFix guides: