
EV charging advertising can improve station economics, but a profitable site usually needs more than ad revenue: utilization, charging margin, parking or idle fees, subscriptions, retail spending, and high equipment uptime all determine whether the numbers actually work. A 150 kW DC fast charger can sell electricity at an attractive retail rate and still lose money if it handles too few sessions, creates expensive utility peaks, or repeatedly sits offline.
Charging sites do have one commercial advantage that gasoline stations rarely offer in the same way.
Time.
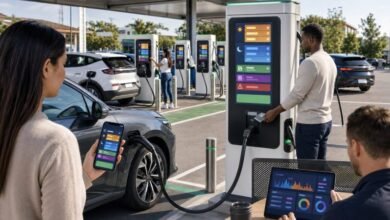
A driver using a 150–350 kW DC charger might remain onsite for 15–40 minutes. Someone connected to a 7–22 kW AC charger at a hotel, workplace, shopping center, or apartment property may occupy the space for several hours.
That dwell can be monetized through digital advertising, sponsorships, nearby retail offers, memberships, parking charges, or combinations of all five.
But there is a trap in the advertising pitch.
A 30-minute charging session does not equal 30 minutes of advertising attention. The driver may spend less than a minute looking at the charger before walking into a store. Any serious business model must therefore separate charging utilization from actual media exposure.
Why EV Charging Revenue Alone Can Produce Thin Margins
The basic charging transaction is easy to calculate.
Sell 45 kWh at $0.50 per kWh and the customer pays:
45 kWh × $0.50 = $22.50.
That is gross revenue.
Not profit.
The operator still has to cover the wholesale or commercial cost of electricity, payment processing, charging-network services, cellular or wired connectivity, software, preventive maintenance, emergency repairs, customer support, insurance, rent or host revenue sharing, and eventually equipment replacement.
Then there is the electrical infrastructure behind the charger.
A commercial DC installation can require a new utility service, transformer, medium- or low-voltage switchgear, protection equipment, meter upgrades, trenching, conduit, copper or aluminum conductors, concrete pads, bollards, networking, lighting, engineering, permitting, accessibility work, commissioning, and sometimes substantial utility-side construction.
The charger cabinet is only one part of the bill.
What Four 150 kW Chargers Can Demand From the Grid
Consider four vehicles simultaneously receiving 150 kW.
Total DC output is:
4 × 150 kW = 600 kW.
The station must draw more than 600 kW from the AC side because rectification, switching electronics, magnetics, conductors, cooling systems, and other components introduce losses.
If AC-to-DC efficiency at that operating point is 94%:
600 kW ÷ 0.94 ≈ 638 kW.
So roughly 638 kW of AC input is required to provide 600 kW of DC output in this simplified example.
And that still does not represent the entire site.
Liquid-cooling pumps, power-module fans, displays, payment terminals, networking hardware, site lighting, security equipment, HVAC, and other auxiliary loads consume additional electricity.
The financial effect depends heavily on the utility tariff.
Some commercial customers are billed mainly for energy consumed. Others face a demand component based on their highest measured load during a defined interval, such as 15 or 30 minutes. In that situation, a brief period with several EVs charging at high power can influence the month’s economics far beyond the electricity consumed during those few minutes.
A 350 kW Nameplate Does Not Generate Revenue
Utilization does.
Imagine a charger completing four sessions per day with 45 kWh delivered during each session.
Daily throughput:
4 × 45 kWh = 180 kWh.
Annual throughput:
180 × 365 = 65,700 kWh.
Now place identical charging hardware at a stronger location delivering 600 kWh every day.
Annual throughput becomes:
600 × 365 = 219,000 kWh.
The second charger delivers more than three times the annual energy despite having the same power rating.
This is why charger utilization, sessions per connector, energy throughput, and gross margin per session usually tell investors more than the largest number printed on the cabinet.
| Economic Factor | How It Affects the Site | Where It Matters Most |
|---|---|---|
| Electricity purchase | Creates a variable cost for every kWh delivered | All paid charging |
| Demand-related charges | High simultaneous power can raise utility costs | High-power DC sites on applicable tariffs |
| Payment processing | Reduces retained transaction revenue | Public paid charging |
| Network and software | Adds recurring operating costs | Connected public infrastructure |
| Maintenance | Costs money directly and can remove revenue-producing capacity | High-utilization sites |
| Property costs | Rent or host revenue sharing reduces operator margin | Third-party sites |
| Low utilization | Spreads fixed costs across too few transactions | New or poorly located chargers |
Why EV Charging Dwell Time Attracts Advertisers
Traditional fuel stops are measured in minutes.
EV charging can stretch considerably longer.
That difference creates potential media inventory, but the value changes with the charging environment.
| Charging Environment | Typical Power | Typical Occupancy Pattern | Likely Monetization Fit |
|---|---|---|---|
| Basic AC charging | 3.6–7.4 kW | Several hours or overnight | Subscriptions, parking, resident plans |
| Commercial AC | 7–22 kW | 1–8+ hours | Parking, membership, destination spending |
| Lower-power DC | 25–60 kW | Often 30–90 minutes | Retail promotions and destination services |
| DC fast charging | 100–200 kW | Often 20–45 minutes | Charging, advertising, retail and food |
| Ultra-fast DC | 250–400+ kW | Potentially 10–30 minutes | High-throughput charging, sponsorship, retail conversion |
Those times are not promises.
A 350 kW charger does not mean every connected EV receives 350 kW. The vehicle’s battery-management system requests the voltage and current it can safely accept, and that request changes continuously during the session.
Battery Voltage Changes Charging Speed and Customer Dwell
Charging economics eventually collide with battery architecture.
Many EVs use battery systems in roughly the 350–450 V class. Newer high-voltage platforms can operate in the 700–900 V region, depending on pack architecture and state of charge.
The electrical relationship is simple:
Power = Voltage × Current.
To deliver 200 kW at 400 V requires approximately:
200,000 W ÷ 400 V = 500 A.
At 800 V:
200,000 W ÷ 800 V = 250 A.
That is a huge current difference.
Resistive heating follows approximately:
Power loss = I²R.
For the same resistance, cutting current reduces conductor losses dramatically. This is one reason high-voltage EV architectures can support very high charging power without relying solely on extreme current.
High-current DC cables still face a serious thermal problem. At several hundred amps, the cable and connector can generate enough heat that liquid cooling becomes necessary to maintain practical cable dimensions and safe component temperatures.
LFP and NMC Batteries Do Not Charge Identically
Battery chemistry adds another variable.
Lithium iron phosphate, or LFP, is widely used because of its cycle-life potential, thermal characteristics, and comparatively low material cost. Nickel-manganese-cobalt, or NMC, generally offers higher gravimetric energy density, which can help reduce pack weight for a given capacity.
Neither chemistry has one universal DC charging curve.
Cell design, anode composition, pack voltage, thermal-management capability, state of charge, battery age, internal resistance, BMS calibration, and manufacturer strategy all influence charging performance.
Temperature is especially important.
When lithium-ion cells are cold, aggressive charging can increase lithium-plating risk at the anode. The BMS responds by restricting charging current until cell temperature reaches a more suitable range.
That is why battery preconditioning matters.
An EV that heats its battery while navigating toward a fast charger may arrive prepared to accept much higher power. The same vehicle arriving with a cold-soaked pack could initially take a fraction of the charger’s advertised capability.
For the charging operator, cold-battery sessions can mean longer stall occupancy.
For a retailer, longer occupancy may mean additional dwell.
For the driver, it usually means waiting.
Six Ways EV Charging Sites Can Make Money
A commercial charging site’s revenue does not need to begin and end at the electricity meter.
1. Charging Fees
Energy sales remain the primary direct income source at many public DC stations.
Pricing rules vary by jurisdiction. Operators may be permitted to bill by energy, charging time, connection time, session, or approved combinations of these methods.
Per-kWh pricing has a clear advantage for drivers: they pay for energy received.
Pure time-based charging can create fairness problems because the EV controls much of the charging speed. A cold battery requesting 45 kW from a 150 kW charger occupies the stall longer than a warm battery taking 130 kW, even though both customers selected identical hardware.
2. Idle Fees
Idle fees are primarily about capacity management.
If an EV finishes charging after 30 minutes but remains connected for another 45 minutes, the charger may be unable to serve the next customer.
At a busy hub, the lost session can be more expensive than the electricity involved.
Well-designed idle policies give drivers clear information about the trigger, grace period, fee rate, and conditions under which charging is considered complete.
3. Parking Fees
Charging and parking are different products.
That distinction matters in city garages, airports, hotels, hospitals, stadiums, transit facilities, and other locations where the parking space already has economic value.
A customer might pay for three hours of parking while purchasing 18 kWh of electricity.
Tracking those revenues separately helps the operator determine whether the charger is financially productive or simply benefiting from a profitable parking business around it.
4. Subscriptions and Memberships
Recurring plans fit locations with repeat customers.
Apartment properties, workplaces, fleets, commuter garages, and regional charging networks are obvious candidates.
A subscription might provide a monthly energy allowance, reduced charging rates, lower session fees, reserved access, or another recurring benefit permitted by local rules.
The attraction is predictable revenue.
But the customer must receive something meaningful in return. Charging people monthly for access to the same rate and service available to everyone else is a weak proposition.
5. Advertising and Sponsorship
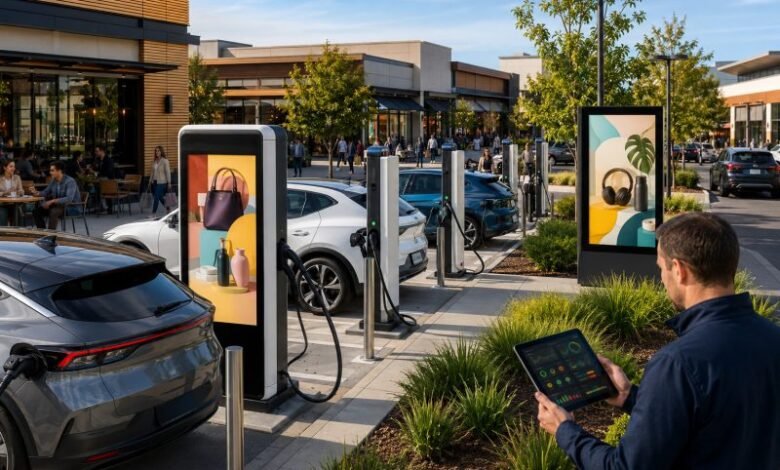
Advertising turns part of the charging site into media inventory.
That inventory can live on a charger touchscreen, a larger dedicated digital display, overhead signage, or another screen positioned around the site.
Sponsorship is usually broader. A company might sponsor a bank of chargers, waiting area, discounted charging period, or entire location in exchange for long-term brand exposure.
6. Retail and Hospitality Spending
This is easy to overlook because it does not appear in the charging backend.
A driver who plugs in and then buys groceries, lunch, coffee, medicine, cinema tickets, or hotel services can generate more commercial value for the host than the charging transaction itself.
For some properties, that is the real reason to install charging.
What EV Charger Advertising Is Actually Selling
The media product is audience exposure at a known location, not the amount of time a connector remains locked into an EV.
Imagine a 32-minute charging session.
The driver spends 45 seconds starting the charger, walks into a supermarket for 27 minutes, returns, checks the session, disconnects, and leaves.
The charger screen did not receive 32 minutes of attention.
It may have received 90 seconds.
Now move the advertising onto a 55-inch display facing the supermarket entrance. Hundreds of shoppers may pass it independently of the charging sessions.
That is a different media asset entirely.
Advertising on the Charger’s Existing Screen
Using the charger’s integrated display minimizes additional hardware.
It also limits audience size.
The screen is normally positioned for the person standing at the charger. Its first responsibility is operating the equipment.
The interface must clearly show information such as:
- Authentication instructions
- Charging price
- Connector selection
- Session status
- Current charging power
- Energy delivered
- Elapsed time
- Current cost where applicable
- Stop controls
- Error messages
Advertising has to fit around those functions.
If promotional content delays the charging session or hides the price, the operator has damaged the core product to monetize a secondary one.
Large-Format Digital Screens
Dedicated displays can reach charging drivers plus pedestrians and other visitors.
But buying the biggest panel available does not guarantee valuable impressions.
Screen economics depend on:
- Viewing distance
- Mounting height
- Pedestrian flow
- Vehicle approach direction
- Screen orientation
- Obstructions
- Daylight readability
- Nighttime brightness
- Audience dwell
- Hourly foot traffic
- Whether people naturally face the display
A 55-inch display facing away from the main walkway can be worth less than a correctly positioned 32-inch screen.
How EV Charging Advertising Can Be Sold
Direct Local Advertising
Local businesses can be unusually good advertising customers because charging locations provide geographic intent.
A restaurant 300 meters away does not necessarily need a nationwide audience. It needs people nearby who have 20 minutes available and may be hungry.
Potential advertisers include:
- Restaurants
- Coffee shops
- Retail stores
- Hotels
- Cinemas
- Car washes
- Tire shops
- Automotive service businesses
- Pharmacies
- Entertainment venues
Campaign timing can add another layer of relevance.
Breakfast offers in the morning. Lunch promotions around noon. Cinema listings in the evening.
Simple, local, useful.
Digital-Out-of-Home Media Partnerships
A charging operator does not have to become an advertising company.
A media partner can handle advertiser acquisition, campaign scheduling, creative approval, reporting, invoicing, and inventory management.
The operator trades part of the advertising revenue for those services.
Whether that trade makes financial sense depends on fill rate.
Giving a media company a significant revenue share can be reasonable if it consistently sells inventory that the charging operator could not sell independently.
Programmatic Advertising
Connected displays can potentially make inventory available through automated digital-out-of-home systems.
That becomes more useful as the network grows because campaigns can target selected locations, periods, or groups of screens without manually updating each site.
Technology does not solve the audience problem.
A programmatic connection to an invisible screen still produces weak inventory.
Long-Term Sponsorship
Sponsorship can provide more predictable income than continuously selling short advertising campaigns.
A brand might sponsor a charging site for six or twelve months. Another agreement might subsidize charging during selected periods in exchange for prominent branding.
Contracted sponsorship income can also be easier to forecast than assumed future advertising sales.
First-Party Promotions May Be Worth More Than Selling the Screen
Retailers should not automatically sell all available advertising inventory to outsiders.
The host may be the highest-value advertiser.
A supermarket can offer charging customers a discount redeemable inside. A hotel can promote its restaurant. A shopping center can advertise tenants. A cinema can display current showtimes.
In these cases, CPM is not necessarily the metric that matters.
The better question is how much incremental gross profit the promotion generates inside the business.
Why Onsite Spending Can Beat the Charging Margin
Take a simplified 40 kWh session.
Assume the operator retains $0.15 per kWh after the direct cost of electricity but before fixed operating expenses.
The charging contribution is:
40 kWh × $0.15 = $6.
The driver then spends $42 inside the store.
Obviously, $42 of sales is not $42 of profit. Cost of goods, labor, taxes, occupancy, and other expenses still apply.
Yet the commercial contribution from the store visit may equal or exceed the value created by charging.
At a retail property, the EV charger may be more valuable for attracting a customer and controlling dwell than for selling electricity.
This should influence charger selection.
A supermarket with a natural 45-minute visit does not necessarily need the same charging architecture as a motorway hub where the driver wants to leave in 18 minutes.
More power is not automatically better.
The right power is better.
For example, a 7 kW or 22 kW AC charger might perfectly match a multi-hour stay, whereas a commercial EV charging station installation with high-power DC hardware would be overkill and unnecessarily expensive for such a location.
Location Can Matter More Than Charging Volume for Advertising
Imagine two sites.
Site A completes 60 charging sessions per day but sits in a remote corner of a parking lot. Only charging customers regularly pass the display.
Site B completes 35 sessions but its screen faces the entrance to a busy shopping center.
Site B could easily be the stronger advertising property.
| Media Factor | Stronger Condition | Weaker Condition |
|---|---|---|
| Pedestrian exposure | Heavy natural foot traffic | Only charging customers pass |
| Viewing angle | Screen faces audience approach | Screen faces away from traffic |
| Audience dwell | People remain nearby | People immediately leave |
| Commercial intent | Retail, food, entertainment or services nearby | Few spending opportunities |
| Display uptime | Reliable screen and connectivity | Frequent failures |
| Measurement | Credible campaign and audience reporting | No defensible data |
Proof of Play Is Not the Same as a Viewed Impression
Professional advertisers need evidence that purchased creative actually appeared.
A digital media system should be capable of logging:
- Site or screen ID
- Campaign ID
- Creative ID
- Playback timestamp
- Creative duration
- Playback result
- Screen health or connectivity status
That proves playback.
It does not prove attention.
If an advertisement runs 1,000 times while the parking aisle is empty, the system may legitimately report 1,000 plays. Reporting 1,000 human views would require additional audience evidence.
Operators should keep those metrics separate.
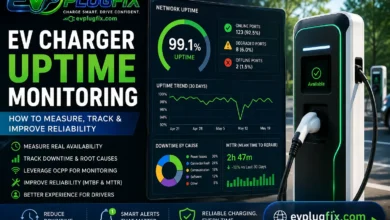
Charger Uptime Affects Every Revenue Stream
A broken charger loses more than one electricity sale.
The advertising screen may go dark. The driver may leave the property. A retailer may lose a purchase. The customer may choose another charging location next time.
Modern DC charging hardware contains a long chain of components that can cause degraded or failed service:
- AC input equipment
- Protection systems
- Power-conversion modules
- DC contactors
- Insulation monitoring
- Control electronics
- Cables and connectors
- Liquid-cooling hardware
- Vehicle communication
- Payment terminals
- Networking hardware
- Backend communication
- Displays
- Firmware and application software
Not every fault takes the charger completely offline.
Some reduce maximum power. Others prevent card payments, interrupt backend communication, or cause intermittent session-start failures.
This is why a simple “online” status is a poor reliability metric.
Operators should also track whether real customers can successfully initiate and complete sessions.
Modular DC Chargers Can Sometimes Keep Working After a Module Failure
Many high-power chargers use multiple AC-to-DC power modules.
A theoretical 240 kW system might contain eight 30 kW modules.
With all eight operating:
8 × 30 kW = 240 kW.
If one module fails, seven represent:
7 × 30 kW = 210 kW.
A charger designed for degraded operation may therefore continue serving vehicles at reduced output.
That is not guaranteed. Fault type, architecture, thermal design, control logic, and safety requirements determine whether continued operation is possible.
Commercially, however, 210 kW is much better than zero.
Dynamic Power Sharing Can Reduce Grid Requirements
Six dispensers rated at 200 kW each create a theoretical combined output of:
6 × 200 kW = 1.2 MW.
Building 1.2 MW of charging capacity may be unnecessary if vehicles rarely request maximum power simultaneously.
One EV might request 185 kW. Another could be tapering at 70 kW. A third may accept 110 kW because of battery temperature or state of charge.
A dynamically managed system can allocate available power among those vehicles.
That may reduce transformer capacity, switchgear size, utility-service requirements, or other infrastructure compared with designing every connector for simultaneous peak output.
Under-sizing the shared power pool creates the opposite problem.
If six cars arrive with warm batteries at low state of charge and the site cannot provide enough aggregate power, charging sessions stretch longer. Turnover drops. Queues can form.
Power sharing should therefore be based on expected simultaneous demand and actual charging curves, not simply the cheapest possible grid connection.
Battery Storage Can Support High-Power Charging on a Constrained Grid Connection
A stationary battery can accumulate energy during lower-demand periods and discharge during high-power charging sessions.
Imagine a site with a 100 kW grid connection.
If the stationary battery and inverter can provide sufficient additional power, a connected EV could temporarily receive far more than 100 kW without the utility connection itself supplying the entire charging peak.
The battery is shifting energy through time.
Nothing about that process is free.
Operators have to model inverter efficiency, battery charging losses, auxiliary consumption, cooling, degradation, usable depth of discharge, cycle life, financing, replacement costs, and electricity-price differences across the day.
LFP is often attractive for stationary storage because repeated cycling can suit its chemistry and thermal characteristics. Lifetime still varies substantially with cell quality, temperature, C-rate, depth of discharge, state-of-charge window, and system controls.
Advertising Must Never Make Charging Harder
The order should be non-negotiable.
Charging first. Advertising second.
A driver should be able to find the following without fighting through promotional content:
- Price
- Available connector
- Authentication method
- Payment instructions
- Session status
- Charging power
- Energy delivered
- Current cost where required
- Stop control
- Error information
A driver arriving at 4% state of charge should not have to watch a 30-second commercial before initiating a session.
Pricing should not disappear behind an advertisement.
Stop controls should not move because a promotional carousel changed screens.
Outdoor display brightness matters too.
A screen bright enough to remain readable under midday sun can become uncomfortable at night. Ambient-light sensing or scheduled luminance control can improve visibility while reducing unnecessary display energy use.
Advertising Measurement Creates Privacy Questions
Charging networks can already handle sensitive commercial and behavioral information.
Depending on the system, that may include account data, payment information, charging history, location, app activity, transaction records, and vehicle-related identifiers.
Adding advertising analytics introduces another dataset.
Combining the two indiscriminately creates unnecessary risk.
Operators need clear rules covering what is collected, why it is collected, who controls it, who can access it, how long it is retained, and what legal basis applies in the relevant jurisdiction.
Useful advertising measurement does not always require identifying individuals.
Aggregated pedestrian counts, campaign playback records, anonymous audience estimates, coupon redemption, and first-party retail transactions can provide useful information without building individual behavioral profiles.
Systems involving cameras, facial analysis, device identifiers, license-plate recognition, or individual tracking deserve far more careful privacy and legal review before deployment.
EV Charging Monetization Mistakes That Can Destroy ROI
Assuming Full Utilization Immediately
New sites need time to build traffic.
Model the ramp.
Financial forecasts should include downside, expected, and upside utilization scenarios rather than assuming mature demand from the first month.
Treating Charging Time as Advertising Attention
A car connected for 30 minutes does not create 30 minutes of screen viewing.
Measure actual audience opportunity.
Assuming Every Advertising Slot Will Sell
Available inventory and sold inventory are not the same thing.
A screen capable of displaying 5,000 commercial spots per week may generate little external media revenue if advertisers buy only 20% of that inventory.
Ignoring Downtime
Perfect availability is not a realistic financial assumption.
Account for maintenance, component failures, communication outages, payment faults, software issues, planned service, and unsuccessful sessions.
Proactive EV charger maintenance costs planning and budgeting can help minimize revenue loss from unexpected downtime.
Buying Too Much Charging Power
An overnight hotel customer does not need a 350 kW charger for an eight-hour stay.
In many cases, appropriately sized AC charging can meet the customer’s energy requirement with dramatically lower electrical infrastructure demands.
Installing Too Little Power at a High-Throughput Site
A motorway hub has different priorities.
Too little power stretches sessions, reduces daily throughput, and creates queues precisely where drivers value speed most.
Choosing Advertising Locations After Construction
Study sightlines before pouring concrete.
Relocating a screen after trenching, cabling, foundations, and commissioning is expensive.
How to Calculate the Total Economic Value of an EV Charging Site
Do not put every dollar into one charging-revenue column.
| Revenue Category | Examples | Useful Metric |
|---|---|---|
| Charging | Energy, time, session charges | Gross margin per kWh or session |
| Space | Parking, reservations, idle fees | Revenue per occupied stall-hour |
| Subscription | Resident, workplace, fleet memberships | Monthly recurring revenue |
| Media | Advertising and sponsorship | Revenue per screen or location |
| Retail uplift | Food, shopping, services | Incremental commercial contribution |
| Property value | Customer attraction and tenant amenity | Visits, retention or relevant property KPI |
Then separate operating expenditure from capital expenditure.
Operating costs may include electricity, demand-related utility charges, payment processing, network fees, communications, software, maintenance, field service, insurance, rent, revenue share, cleaning, customer support, advertising commissions, and display management.
Capital costs can include chargers, transformers, switchgear, protection, utility upgrades, conduit, cable, trenching, foundations, engineering, permits, commissioning, lighting, bollards, networking, canopies, battery storage, and advertising displays.
That separation matters when calculating payback, cash flow, asset replacement, and long-term return.
Understanding public EV charging pricing strategies is essential to setting competitive rates that balance driver appeal with healthy margins.
KPIs Every Commercial Charging Site Should Track
| KPI | What It Reveals |
|---|---|
| Sessions per connector per day | Actual charger utilization |
| kWh per connector per day | Energy throughput |
| Average session energy | Typical customer energy purchase |
| Average connection duration | Dwell and stall occupation |
| Average charging power | Difference between rated and delivered power |
| Peak site demand | Infrastructure and potential tariff exposure |
| Successful session-start rate | Whether drivers can actually initiate charging |
| Operational availability | Equipment readiness |
| Revenue per connector | Asset productivity |
| Maintenance cost per connector | Lifecycle operating burden |
| Advertising fill rate | Percentage of sellable media inventory actually sold |
| Media revenue per screen | Real advertising productivity |
| Retail conversion | Whether charging visits generate onsite purchases |
Site averages can hide bad hardware.
A four-charger location may appear healthy even if one connector fails half its attempted sessions while the other three carry the traffic.
Measure individual assets whenever possible.
How to Pilot EV Charger Advertising Before Scaling
Do not install advertising displays across 500 charging sites simply because the first sales presentation looked promising.
Pilot the model.
- Select different location types. Include retail, destination, highway, or parking sites representative of the intended rollout.
- Establish a charging baseline. Measure sessions, kWh, uptime, revenue, dwell, and stall utilization before introducing advertising.
- Study customer movement.